
Figures & data
Figure 1. Correlation between true monthly and interpolated UN personnel numbers.
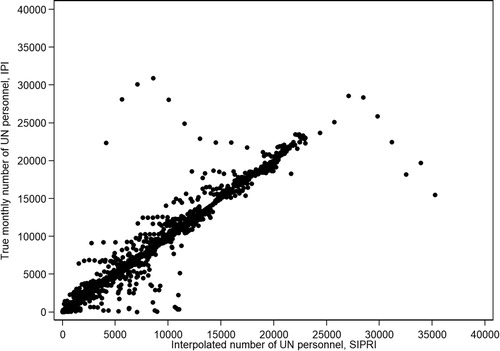
Figure 2. True and interpolated personnel numbers, MINUSTAH & MONUC.
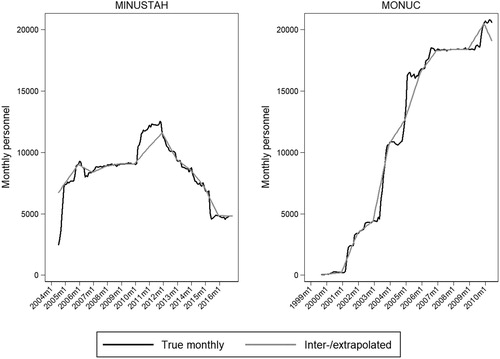
Figure 3. Number of missions vs number of personnel, by actor.
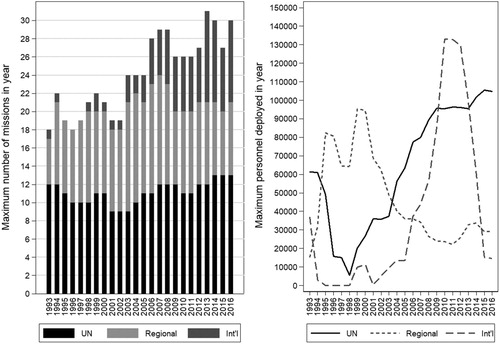
Figure 4. Size of UN versus non-UN missions.
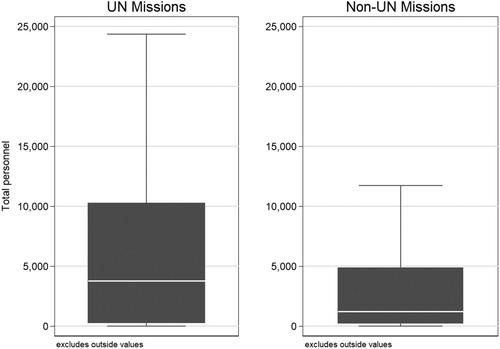
Figure 5. Personnel composition of UN versus non-UN missions.
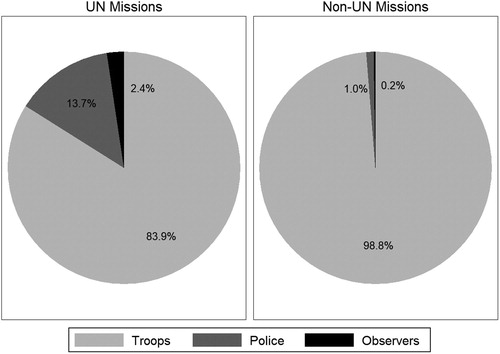
Figure 6. Observations with UN/non-UN partnership peacekeeping.
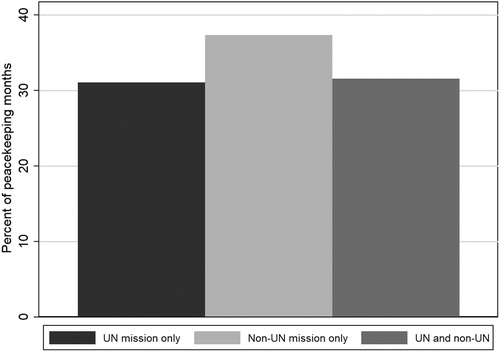
Figure 7. Average violence levels in the past 6 months before mission entry.
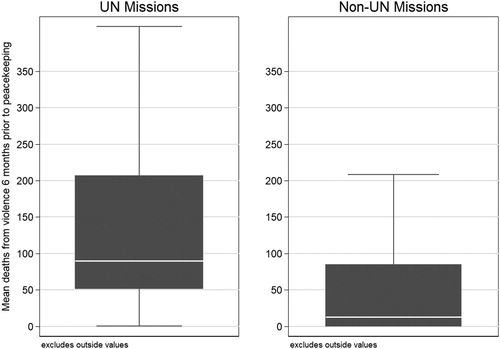
Table 1. Comparing the effect of UN and regional peacekeeping on one-sided violence.
Figure 8. Coefficient plot comparing effect of troops and police by sender type [with different samples].
![Figure 8. Coefficient plot comparing effect of troops and police by sender type [with different samples].](/cms/asset/4638d87b-1c6a-497b-8945-eef08a7a8905/finp_a_1737023_f0008_ob.jpg)
Supplemental material