
Figures & data
Figure 1. Distribution of the dependent variable proportion of female military personnel in a TCC’s contribution to UN peacekeeping.
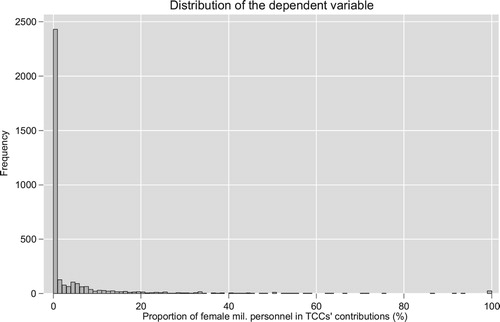
Table 1. Descriptive statistics of main variables and controls.
Figure 2. The share of female military personnel in UN missions 2006-2015. Source: SIPRI Multilateral Peace Operations Database.
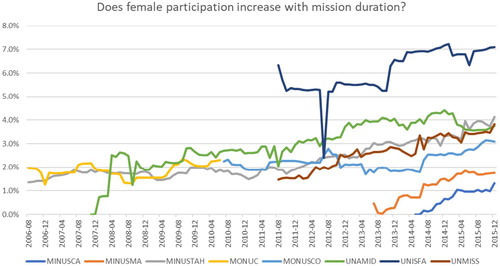
Table 2. Mixed effects regression of the proportion of women in military contributions.
Figure 3. Predicted effect of new mission.
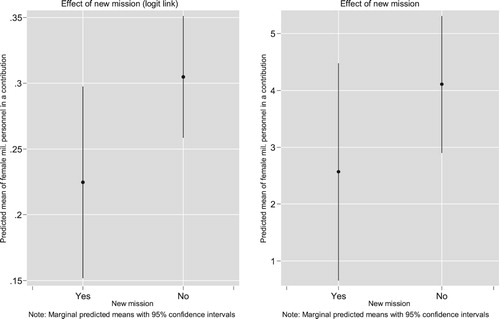
Figure 4. Predicted effect of duration (years).
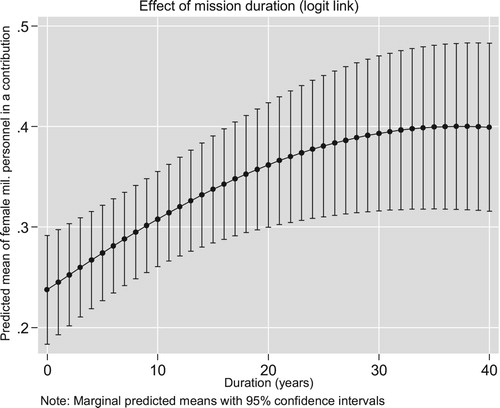
Figure 5. Women in TCCs’ labour forces and the proportion of female military personnel in contributions to new missions.
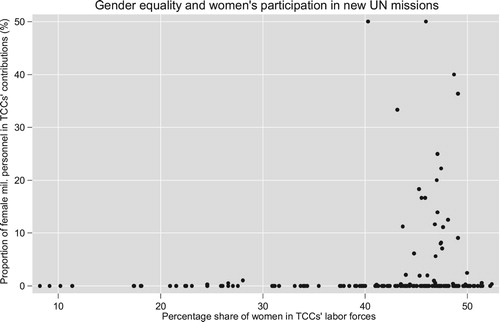
Table 3. Extended analysis and robustness tests, mixed effects regression of the proportion of women in military contributions.
Data Availability Statement
Replication files and online appendix are available at: https://www.pcr.uu.se/data/replication-data/