Figures & data
Figure 1. The life-cycle of coronavirus. This figure shows the life-cycle coronaviruses. This figure also shows the steps where the nsp13 inhibitors are expected to exert the inhibitory steps. It is clear from the figure that the nsp13 inhibitors can act at the (+) sense RNA or (-) sense RNA synthesis or at both steps. Since, it is not well defined which step the replicase complex is engulfed within the double membrane vesicles (DMVs), we have shown only one step within the DMVs
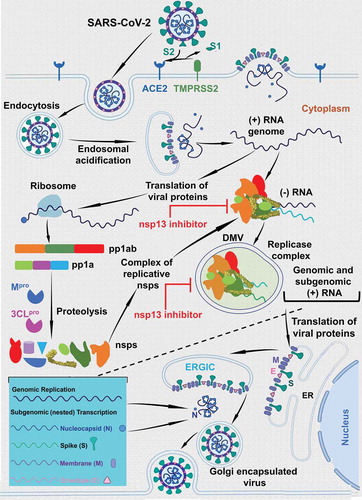
Figure 2. Structure of SARS-CoV nsp13. This figure shows the overall structure and domain organization of SARS-CoV nsp13. This figure was generated by PyMol [Citation57]
![Figure 2. Structure of SARS-CoV nsp13. This figure shows the overall structure and domain organization of SARS-CoV nsp13. This figure was generated by PyMol [Citation57]](/cms/asset/0bafbd1d-5bd1-492e-906d-c44890143ed6/ietp_a_1884224_f0002_oc.jpg)
Figure 3. Panel A shows potential small molecule inhibitor binding pockets (yellow space-filled atoms) in the structure of SARS-CoV as determined by SiteID program (Tripos Associates, St. Louis, MO). These binding sites were calculated from the crystal structure of SARS-CoV nsp13 (PDB file 6JYT [Citation47]) after changing selenomethionine residues to methionine. Panel B shows the close up of conserved motifs, computed small molecule binding pockets and SSYA10–001 binding site residues K508 and Y277 (shown as ball-and-sticks). The dotted line represents (42 Å) the distance between two Cα-atoms of Y227 and K508. Residues that interact with K508 from Motifs IV and V are also shown in this panel. The carbon, nitrogen and oxygen atoms are colored as white, blue and red, respectively. This figure was generated by Sybyl X (Certara, St. Louis, MO)
![Figure 3. Panel A shows potential small molecule inhibitor binding pockets (yellow space-filled atoms) in the structure of SARS-CoV as determined by SiteID program (Tripos Associates, St. Louis, MO). These binding sites were calculated from the crystal structure of SARS-CoV nsp13 (PDB file 6JYT [Citation47]) after changing selenomethionine residues to methionine. Panel B shows the close up of conserved motifs, computed small molecule binding pockets and SSYA10–001 binding site residues K508 and Y277 (shown as ball-and-sticks). The dotted line represents (42 Å) the distance between two Cα-atoms of Y227 and K508. Residues that interact with K508 from Motifs IV and V are also shown in this panel. The carbon, nitrogen and oxygen atoms are colored as white, blue and red, respectively. This figure was generated by Sybyl X (Certara, St. Louis, MO)](/cms/asset/b171cac2-97e3-4bc0-b1a6-8409061491d8/ietp_a_1884224_f0003_oc.jpg)
Figure 4. Phylogenetic analyses of CoVs and conservation of motifs among selected CoVs. The dendrogram shows the evolutionary relationship among hCoVs, MHV and RaTG13 using amino acid sequence of nsp13. Note that SARS-VoV-2 is closely related to RaTG13 (purple highlighted node). This figure also shows the sequence alignment of six conserved nsp13 motifs together with SSYA10–001 binding site residues marked as asterisks (*). The amino acid sequence is color coded. Dash (–) represents the gap in the sequences of nsp13, and AA represents amino acids. The figure was generated using the R package ggtree [Citation61]. The R programing language [Citation62] was used to generate this figure, . The in-house generated R codes for these figures are available upon request
![Figure 4. Phylogenetic analyses of CoVs and conservation of motifs among selected CoVs. The dendrogram shows the evolutionary relationship among hCoVs, MHV and RaTG13 using amino acid sequence of nsp13. Note that SARS-VoV-2 is closely related to RaTG13 (purple highlighted node). This figure also shows the sequence alignment of six conserved nsp13 motifs together with SSYA10–001 binding site residues marked as asterisks (*). The amino acid sequence is color coded. Dash (–) represents the gap in the sequences of nsp13, and AA represents amino acids. The figure was generated using the R package ggtree [Citation61]. The R programing language [Citation62] was used to generate this figure, Figures 6 and 7. The in-house generated R codes for these figures are available upon request](/cms/asset/cf8f57f8-aca4-4939-8647-3ecbf2d96ee6/ietp_a_1884224_f0004_oc.jpg)
Figure 5. Structure of SSYA10–001 and related compounds. The compounds were searched from PubChem database using SSYA10–001 as template. The compounds were scored using Tanimoto fingerprints [Citation66]
![Figure 5. Structure of SSYA10–001 and related compounds. The compounds were searched from PubChem database using SSYA10–001 as template. The compounds were scored using Tanimoto fingerprints [Citation66]](/cms/asset/17f8fdc6-048f-499d-af91-a60e6e6b9ee4/ietp_a_1884224_f0005_b.gif)
Table 1. List of compounds in PubChem sharing structural similarity with SSYA10–001
Figure 6. A structural property comparison of SSYA10-100 and related compounds. This heatmap and dendrogram show the relationship among SSYA10–001 and seven compounds identified from PubChem. ChemMine Tool [Citation65] and in-house R code (available upon request) was used to generate structural relationships among the compounds. Similarity scale (range of Z-scores) shown at the top of figure refers to as the most similar structure being blue or zero Z-score, and most dissimilar structure as red or Z-score equal to 1
![Figure 6. A structural property comparison of SSYA10-100 and related compounds. This heatmap and dendrogram show the relationship among SSYA10–001 and seven compounds identified from PubChem. ChemMine Tool [Citation65] and in-house R code (available upon request) was used to generate structural relationships among the compounds. Similarity scale (range of Z-scores) shown at the top of figure refers to as the most similar structure being blue or zero Z-score, and most dissimilar structure as red or Z-score equal to 1](/cms/asset/73e96456-0cfb-437c-a772-64b5b1c31b16/ietp_a_1884224_f0006_oc.jpg)
Figure 7. A comparison of physico-chemical properties of SSYA10–100 and related compounds. Panel A shows the comparison of physico-chemical properties of SSYA10–001 with the compounds in . The physico-chemical properties were determined using Open Babel chemical toolbox [Citation67]. These properties include H-bond donor (HBD), aromatic bonds (ArBD), H-bond acceptors (HBA), and molecular weight (MW). For simplicity, Open Babel descriptors HBA1 and HBA2 were added and represented as HBA. Additionally, Open Babel descriptor ‘abonds’ was changed to ‘ArBD’ for clarity. Panel B shows the bar plot of computed octanol/water partition coefficient (logP) of the compounds. The scale, height and the color of the bar represent the range of logP. This figure was generated using an in-house R code (available upon request)
![Figure 7. A comparison of physico-chemical properties of SSYA10–100 and related compounds. Panel A shows the comparison of physico-chemical properties of SSYA10–001 with the compounds in Table 1. The physico-chemical properties were determined using Open Babel chemical toolbox [Citation67]. These properties include H-bond donor (HBD), aromatic bonds (ArBD), H-bond acceptors (HBA), and molecular weight (MW). For simplicity, Open Babel descriptors HBA1 and HBA2 were added and represented as HBA. Additionally, Open Babel descriptor ‘abonds’ was changed to ‘ArBD’ for clarity. Panel B shows the bar plot of computed octanol/water partition coefficient (logP) of the compounds. The scale, height and the color of the bar represent the range of logP. This figure was generated using an in-house R code (available upon request)](/cms/asset/02554bd3-416c-4b57-9f75-5cfe26256ce9/ietp_a_1884224_f0007_oc.jpg)
Figure 8. Structures of naturally occurring flavonoids and patented 3,5-dihydroxychromone compounds. Green shaded oval represents dihydroxychromone chemical group, which was used in the patents (KR20110006083A; 2011)
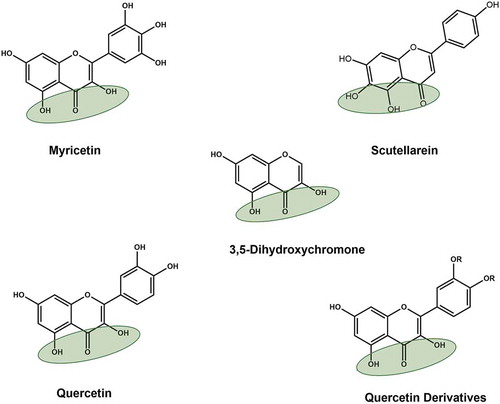
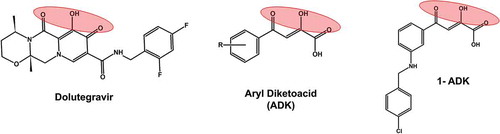
Figure 9. Structural comparison of diketoacid group containing compounds. A well-known HIV-1 integrase inhibitors dolutegravir, which has a diketoacid group is included as a reference compound. The other two structures represent patented inhibitors of SARS-CoV nsp13 inhibitors. 1-ADK refers to a patented compound 1 containing ADK group (KR20110006083A; 2011)