
Figures & data
Figure 1. Metabolism and key structural elements of bemnifosbuvir.
The metabolic activation and key elements of bemnifosbuvir are illustrated. Key elements include (1) the hemisulfate (0.5 H2SO4) salt which enhances solubility of the orally administered tablet; (2) the 5’-phosphoramidate moiety which facilitates oral bioavailability and target cell uptake; (3) the N6-methyl group which stabilizes the glycosidic bond, preventing formation of toxic metabolites, increasing target cell update, and enhancing formation of the triphosphate active metabolite AT-9010 through monophosphate intermediates M2 and M3; and (4) the 2’-fluoro-2’-C-methyl substitution which provides selective inhibitory activity against the viral RNA polymerase. As described in the text, after dissolution of AT-527 to release AT-511, multiple enzymatic steps convert AT-511 to AT-9010. ADALP1, adenosine deaminase-like protein 1; CatA, human cathepsin A; CES1, carboxylesterase 1; GUK1, guanylate kinase 1; Hint1, histidine triad nucleotide-binding protein 1; 5’-NTase, 5’- nucleotidase; NDPK, nucleotide diphosphate kinase.
BEM activation processes:
BEM undergoes sequential hydrolysis, catalyzed by human CatA and/or CES1 followed by spontaneous cleavage of the unstable phenolic moiety, produces the L-alanyl intermediate (M1). Removal of the amino acid moiety by HINT1 results in metabolite M2 which is then converted to M3 by ADALP1. M3 is further anabolized sequentially by GUK1 and NDPK to the pharmacologically active triphosphate, AT-9010. Both M2 and M3 can be dephosphorylated by 5’-NTase to the corresponding nucleosides M4 and AT-273.
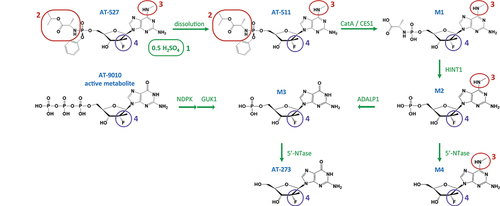
Figure 2. HCV RNA changes over 7 days of bemnifosbuvir monotherapy.
HCV RNA mean changes from baseline with one standard deviations are shown for (a) the bemnifosbuvir dose-response in non-cirrhotic patients with GT1b infection (138, 277, and 553 mg/day), and (b) bemnifosbuvir 550 mg/day in non-cirrhotic patients with GT1b infection, non-cirrhotic patients with GT3 infection and cirrhotic patients with GT1b, 2 or 3 infection. The shaded areas indicate BEM dosing periods.
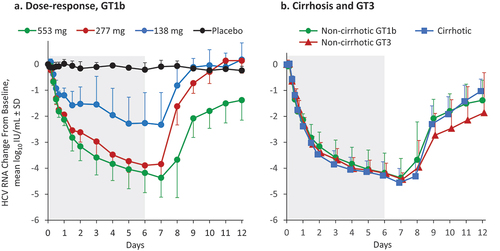
Figure 3. Pharmacokinetic/Pharmacodynamic analysis in patients with or without cirrhosis.
Relationships between AT-273 plasma PK and HCV RNA reductions are shown for (a) non-cirrhotic participants with GT1b HCV; (b) cirrhotic participants with GT1b HCV; (c) non-cirrhotic participants with GT 3 HCV; (d) cirrhotic participants with GT3 HCV; and (e) cirrhotic participant with GT2 HCV. Blue spots indicate mean AT-273 trough concentrations (Cτ) ± standard deviations. Horizontal lines indicate the BEM concentration (expressed as AT-273 equivalent) required to achieve 95% inhibition of the HCV clinical isolates in vitro (EC95) [Citation14]
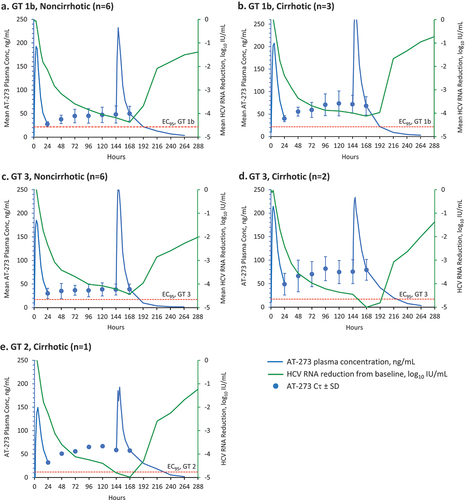
Figure 4. Emax model of bemnifosbuvir dose/anti-HCV response.
Relationship between AT-273 AUCτ and HCV RNA change from baseline after 7 days of BEM treatment is illustrated. The various symbols represent individual values for HCV RNA reductions, with the different symbols identifying HCV genotype, BEM dose, and cirrhosis status as shown.
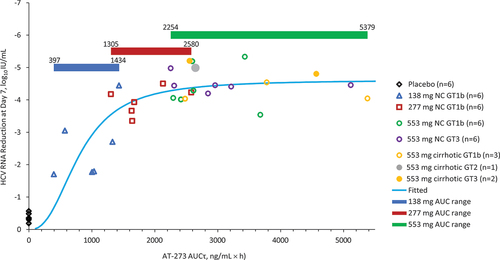
Figure 5. Viral kinetic simulation of bemnifosbuvir 550 mg QD as a single agent.
The blue line indicates the proportions of participants estimated to achieve HCV RNA below the lower limit of quantitation (LLOQ) over time; the green line indicates the proportions achieving HCV RNA less than 1 IU/mL over time, which is estimated to predict a durable cure.
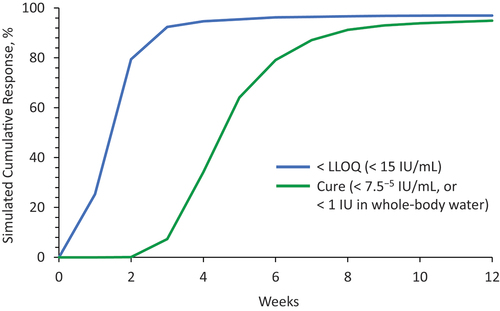
Table 1. Virologic outcomes with bemnifosbuvir + DCV.