Figures & data
Figure 1. Sketch of the experimental set-up.
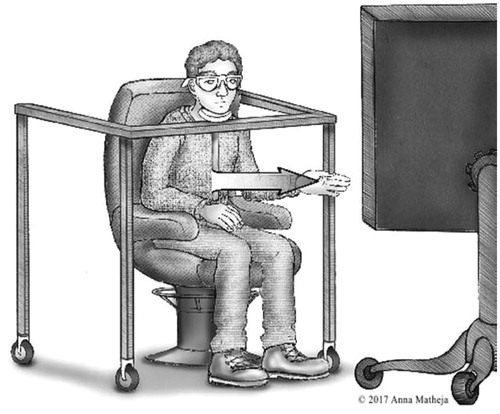
Figure 2. Examples of the perception task with four identical jars (left) and one problem task in the normal arrangement condition (right).
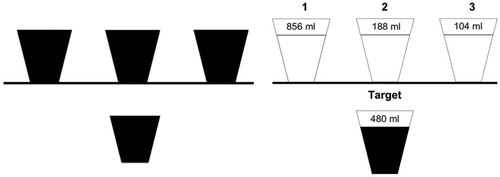
Figure 3. Mean gaze distribution and SD (in per cent) for the perception tasks (left panel) and the first 10 s of problem solving (right panel).
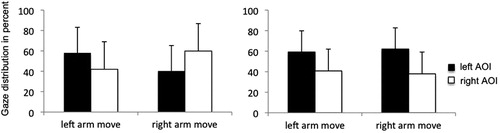
Figure 4. Proportion for the correct solutions in the congruent (left) and incongruent (right) trials.
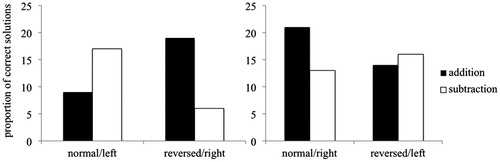
Figure 5. Experimental setup for the second study with the two possible solutions (addition solution 12 + 12 + 97 = 121, subtraction solution 121-12-12 = 97).
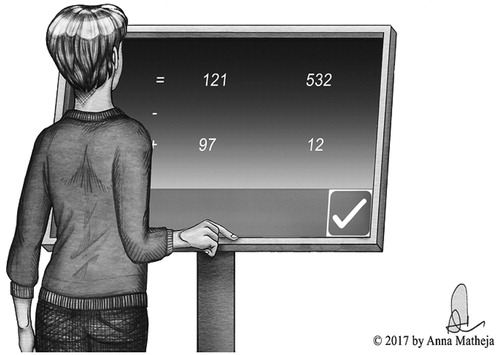
Figure 6. Proportion of addition minus subtraction solutions across all 10 “either” trials for left and right arm movement. Error bars indicate standard error (SE).
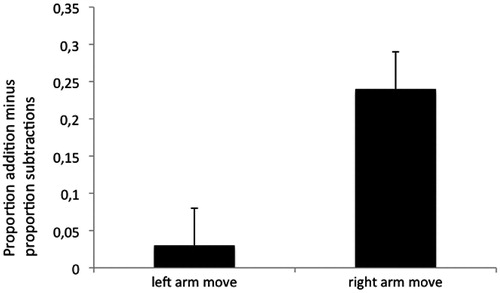
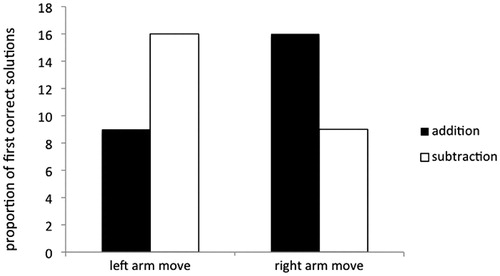
Figure 7. Distribution of first correct solutions in the either category for left and right arm movement groups.