
Figures & data
Table 1. Percentage of visual and verbal problems solved by designers and financiers (with mean out of 3 and 95% confidence intervals) and solution times (with 95% confidence intervals) in Experiment 1.
Table 2. Solution rates, n = 16 in each group (with Χ2 comparisons between groups) and mean solution times (with t test comparisons between groups where there were sufficient data points) for each problem in Experiment 1.
Table 3. Attempts, numbers of participants encountering impasse, mean impasse latencies, and mean number of cognitive and physical activities pre- and post-impasse for each problem in Experiment 1.
Figure 1. Mean number of physical activities pre-impasse involving drawing, hand movements, movement of problem objects and reorientation of problem view by designers and financiers for visual and verbal problems in Experiment 1.
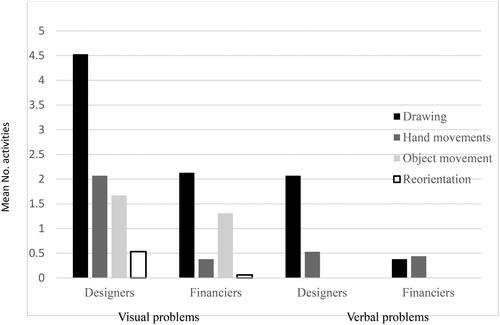
Figure 2. Mean number of physical activities post-impasse involving drawing, hand movements, movement of problem objects and reorientation of problem view by designers and financiers for visual and verbal problems in Experiment 1.
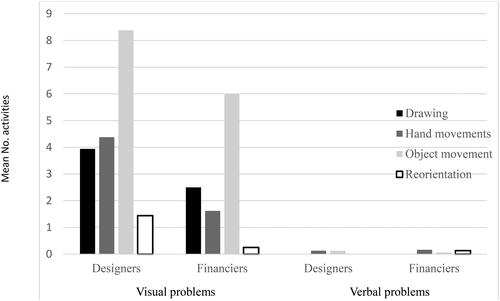
Table 4. Percentage of visual problems solved (with mean out of 5 and 95% confidence intervals) and solution times in the first section of Experiment 2.
Table 5. Solution rates, (n = 14 experts, n = 16 novices, in each group) and mean solution times for each problem and condition in Experiment 2.