
Figures & data
Figure 1. The Bayes factors (BF10) quantify the relative probability of the alternative hypothesis vs the null hypothesis (Wagenmakers, Citation2007).
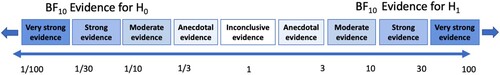
Table 1. Descriptive data for the total sample (n = 30) and grouped karyotypes (age, mean scores of AQ, ASRS, WAIS).
Figure 2. Percentage of the sample with a verbal > non-verbal IQ split.
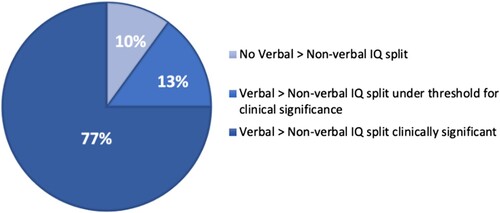
Table 2. Within-subject discrepancies between index scores in WAIS-IV.
Table 3. Comparisons between WAIS-IV mean subscale scores and mean values of all 10 subscales.
Figure 3. Total AQ scores and results from AQ subscales. Boxes cover the 25–75th percentile. Individual data points are shown by black dots.
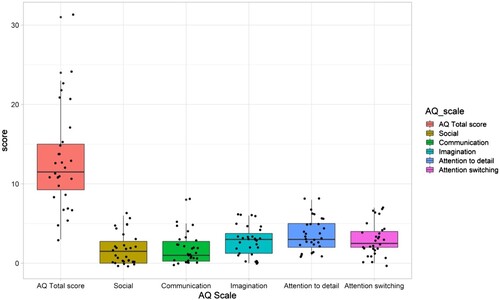
Figure 4. FSIQ and WAIS-IV index scores in the full sample (n = 30) and in the sample clustered grouped by karyotype. Mon. = monosomy 45,X (n = 13), mos. = mosaicism 45,X/46,XX (n = 5), other* (n = 9), unknown (n = 3). Boxes cover the 25–75th percentile. Black lines show medians. Red diamonds show group means. Individual data points are shown by black dots. *The group “other” was created to not omit individual karyotypes and consisted of karyotypes with structural abnormalities or mosaicism other than 45,X/46,XX.
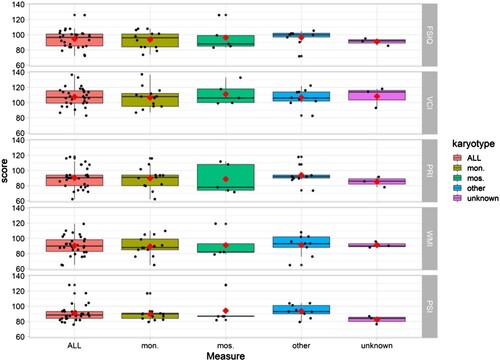
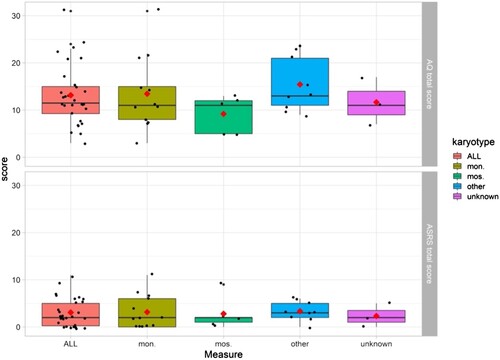
Figure 5. AQ and ASRS scores in the full sample (n = 30) and in the sample clustered grouped by karyotype. Mon. = monosomy 45,X (n = 13), mos. = mosaicism 45,X/46,XX (n = 5), other* (n = 9), unknown (n = 3). Boxes cover the 25–75th percentile. Black lines show medians. Red diamonds show group means. Individual data points are shown by black dots. *The group “other” was created to not omit individual karyotypes and consisted of karyotypes with structural abnormalities or mosaicism other than 45,X/46,XX.
Data availability
The data that support the findings of this study are available from the corresponding author, H.B.A., upon reasonable request.