Figures & data
Figure 1. Mouse Nat2 expression in the developing neuroendocrine system. (A) X-gal stained whole-mount e 8.5 embryos, with Nat2*null expression visualized by x-gal stain. Left panel: ventral view of Nat2−/ − embryo; right hand panel: Nat2+/ + sibling control for endogenous β-galactosidase activity. (B) Whole-mount preparation showing sensory placodes in Nat2−/ − embryos at e 10.5. Left panel: embryo made transparent with benzyl alcohol/benzoylbenzoate, arrowheads indicate optic cup, olfactory epithelium and epibranchial placode; right panels: ventral views of partially dissected whole-mount preparations showing primitive mouth (stomatodeum), olfactory epithelia and optic stalk (arrowheads). (C) Whole-mount preparation of e 11.5 embryo. Arrowheads indicate Rathke's pouch, floor of the IVth ventricle, and mesonephric ducts, arrow indicates developing nodose ganglion. (D) Sections of x-gal stained e 11.5 Nat2−/ − embryos, haematoxylin counterstained, showing components of the neuroendocrine system; Rathke's pouch, the retina, vomeronasal organ, sympathetic ganglia and mesonephric tubules (arrowheads). Scale bars: (A) 250 µm, (B–D) 500 µm. OV, otic vesicle; OC, optic cup; Oe, olfactory epithelium; EP, epibranchial placode; St, stomatodeum; OS, optic stalk; IV, fourth ventricle; RP, Rathke's pouch; VNO, vomeronasal organ; SG, sympathetic ganglion; Mn, mesonephric tubule. Colour available online.
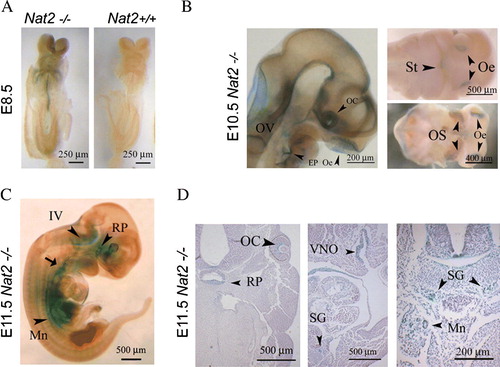
Figure 2. Nat2 protein distribution and enzymatic activity at embryonic day 11.5. (A) Nat2−/ − embryo at e 11.5, x-gal stained and prepared as whole mount. Panels show x-gal stain in transverse sections at the level of the heart (plane indicated on whole-mount preparation) in Nat2−/ − and Nat2+/ + siblings; blue x-gal staining in the sympathetic ganglia of Nat2−/ − embryos, viewed also under high magnification, indicates Nat2 gene expression. (B) Whole-mount preparation of x-gal stained Nat2+/ + sibling illustrating the low level of endogenous β-galactosidase. Panels show transverse sections through a Nat2+/ + embryo at the level of the heart, as indicated on the whole-mount preparation. Sections were probed with mouse Nat2-specific polyclonal antibody 184 (Ab184) (Stanley et al. Citation1998) or preimmune serum (Pre-imm) as indicated and visualized using alkaline phosphatase (AP)-conjugated fast red. Red stain viewed also under high magnification indicates the presence of Nat2 protein. SG, sympathetic ganglia; RCV, right cardinal vein; Lb, lung bud. (C) Transverse section through a Nat2−/ − embryo fixed and stained with x-gal (blue) to reveal Nat2 expression and subsequently treated with a monoclonal antibody to neurofilament, visualized with AP-conjugated fast red to distinguish neuronal (red) from glial cells. Centre and right panels are high magnification views of the sympathetic chain on the left and right side of the embryo indicated with black arrows (left panel). (D) Western blot of homogenates of e11.5 Nat2+/ + and Nat2−/ − embryos testing for the presence of Nat2 protein in Nat2+/ + and Nat2−/ − embryos (n=6 per genotype). In vitro acetylation assays using Nat2-specific substrate para-aminobenzoic acid (pABA) and acetyl coenzymeA, assaying Nat2-dependent acetylating activity in homogenates of e 11.5 Nat2+/ + and Nat2−/ − embryos (n>6 per genotype for each of two independent experiments). Tissues from Nat2+/ + and Nat2−/ − embryos show a significant difference in pABA-specific acetylation activity (p=0.03). NT, neural tube; Nc, notochord; DRG, dorsal root ganglion; SG, sympathetic ganglion; LCV, left cardinal vein; RCV, right cardinal vein. Colour available online.
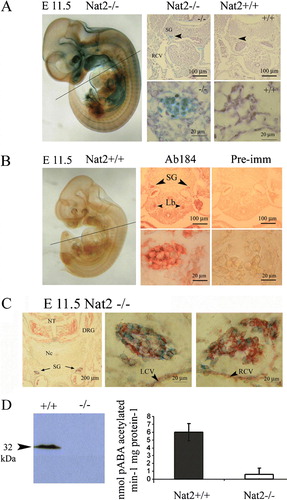
Figure 3. Nat2 expression in adult heart. Nat2 expression detected by x-gal staining in sections through the short axis of 8-week-old adult Nat2−/ − and control Nat2+/ + mouse hearts at the level of the tricuspid valve. (A–D) Right atrium; (E–H) coronary sinus (both left and right ventricular myocardium visible in (E). Site of Nat2 expression are indicated by arrowheads in frame (F). All samples were counterstained with haematoxylin. Scale bars: (A, C, E, G) 200 µm; (B, D, F, H) 20 µm. LV, left ventricle; RV, right ventricle; CS, coronary sinus. Colour available online.
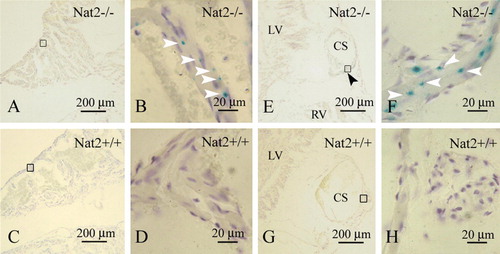
Figure 4. Nat2 expression and catalytic activity in adrenal glands. (A) Western blot of adrenal gland homogenates from male and female adult Nat2+/ + and Nat2−/ − mice probed with polyclonal antibody 184 at 1:4000 to detect Nat2. (B) Nat2 N-acetylation activity assayed in vitro using mouse Nat2-specific substrate para-aminobenzoic acid (pABA). Cytoplasmic homogenates from adrenal glands of adult male and female Nat2+/ + and Nat2−/ − mice were assayed for their ability to N-acetylate pABA. pABA acetylation rates in adrenal glands from Nat2+/ + and Nat2−/ − are significantly different (p=2×10⁻⁵, n=9 per sex and per genotype tested in three independent assays). Samples from males and from females do not show significant differences in acetylation rate. (C and D) Transverse sections through bluo-gal stained adrenal glands isolated from adult Nat2−/ − (C) and Nat2+/ + (D) female mice. Ca, capsule; Zf, zona fasciculate. Scale bars: 100 µm. Colour available online.
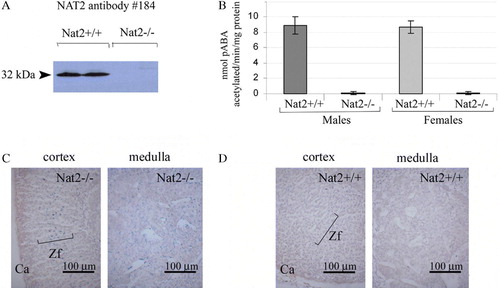
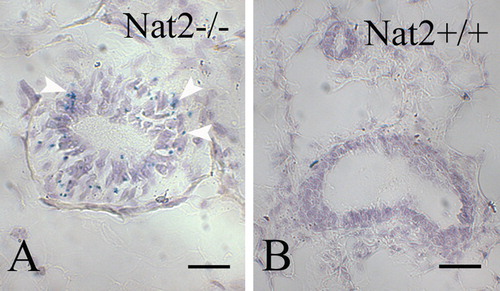
Figure 5. Nat2 expression in oviduct epithelia. Transverse sections through bluo-gal stained oviducts of adult female Nat2−/ − and Nat2+/ + mice, analyzed for Nat2 expression and Nat2 protein; blue stain indicates Nat2 expression, detectable in Nat2−/ − tissues (A and C), red stain indicates Nat2 protein in Nat2+/ + tissues (D). (A and C) Sections through bluo-gal stained oviduct isolated from Nat2−/ − mice. (B and D) Sections through bluo-gal stained control Nat2+/ + mice. (C and D) After x-gal staining, sectioning and dewaxing, sections were probed with polyclonal anti-Nat2 antibody 184, visualized with alkaline phosphatase-conjugated fast red, to confirm the presence of Nat2 in Nat2+/ + tissues. Scale bars: (A, B) 20 µm; (C, D) 100 µm. Colour available online.
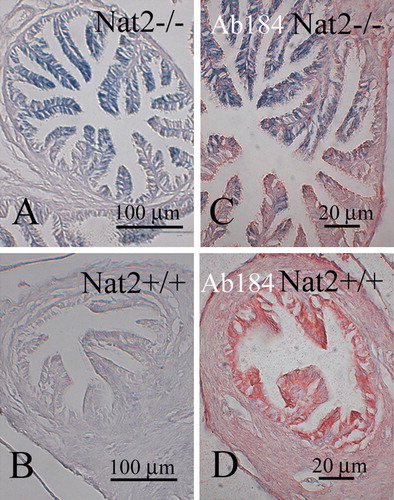
Figure 6. Nat2 expression in mouse mammary gland epithelia. (A and B) Sections through bluo-gal stained mammary gland isolated from Nat2−/ − (A) and Nat2+/ + (control) (B) adult virgin female mice. Blue stain (bluo-gal β-galactosidase substrate) indicates Nat2 expression, detectable in Nat2−/ − tissues, highlighted with arrow heads. Scale bars: (A, B) 20 µm. Colour available online.