
Figures & data
Figure 1. Analysis of the image of a comet. (a) Head DNA; (b) tail DNA; (c) head area; (d) tail area; (e) head radius; (f) tail length.
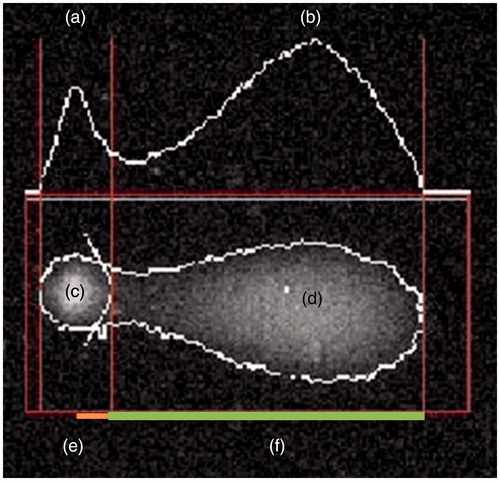
Figure 2. Classes of DNA damage. Source: Waters DJ et al. (Citation2007).
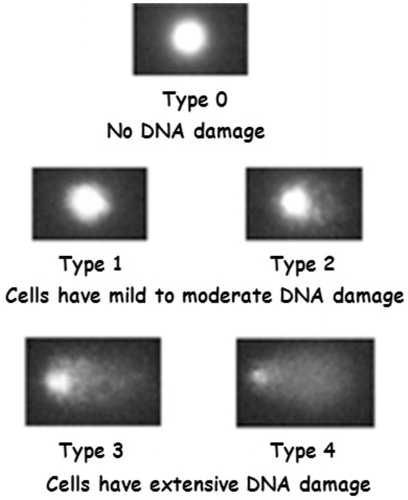
Table 1. General characteristics of the two groups.
Figure 3. Fluorescence microscopy images of cells corresponding to some pesticide exposed subjects.
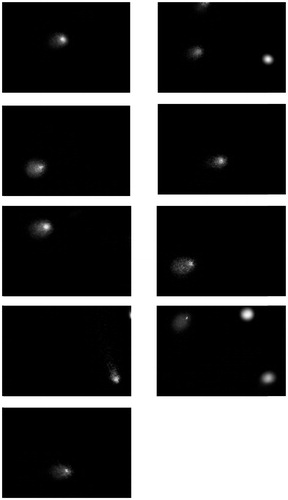
Figure 4. Fluorescence microscopy images of cells of some controls.
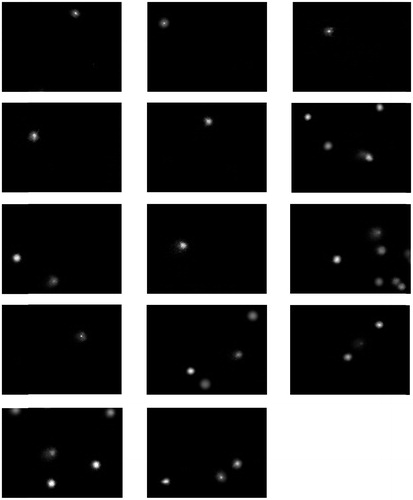
Figure 5. Untransformed and log-transformed distributions of comet assay parameters.
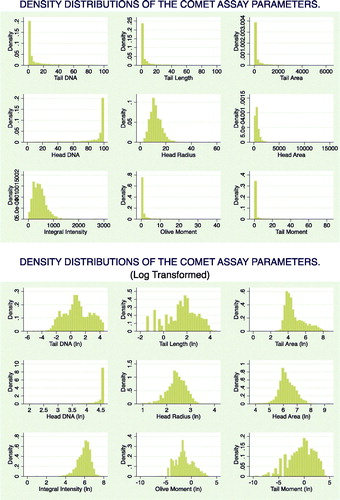
Figure 6. Regression line between Exposure increasing values of pesticides exposure and Tail Moment (Ln). (F = 152.29; p(F) = .000; Adj R2 = 0.1307; t = 12.34; p(t) = .000; β = 0.20).
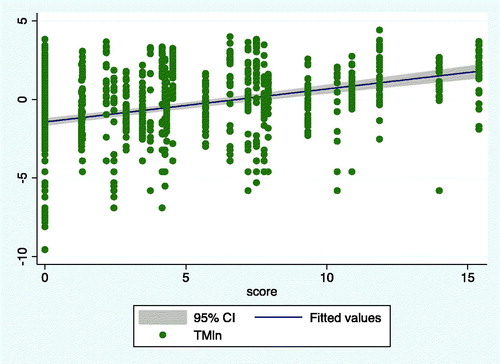
Figure 7. Correlation matrix of log transformed parameters measured by means of comet assay. TMln: tail moment[ln]; HDln: head DNA[ln]; TDln: tail DNA[ln]; OMln: olive moment[ln]; HAln: head area[ln]; IIln: Integral Intensity[ln]; HRln: head radius[ln]; TLln: tail length[ln]; TAln: tail area[ln]; SCln: score[ln].
![Figure 7. Correlation matrix of log transformed parameters measured by means of comet assay. TMln: tail moment[ln]; HDln: head DNA[ln]; TDln: tail DNA[ln]; OMln: olive moment[ln]; HAln: head area[ln]; IIln: Integral Intensity[ln]; HRln: head radius[ln]; TLln: tail length[ln]; TAln: tail area[ln]; SCln: score[ln].](/cms/asset/bd89ccdb-1c9e-4957-89aa-dd657d08551e/ibmk_a_1443513_f0007_c.jpg)
Table 2. Risk (OR) to observe values of comet parameters above the 75th percentile.
Table 3. Adjusted risk estimates (ORs) by confounding variables (age, sex and smoking habits) by means of unconditional logistic regression models.
Table 4. Sensitivity, specificity and predictive positive value (PPV) of the comet assay toward the pesticide exposure.