
Figures & data
Figure 1. Classification of differentially methylated gene loci. A. Rules for classifying loci with FDR p value <0.05 (contrast p values). B. Major categories of differentially methylated gene loci and number of loci per category.
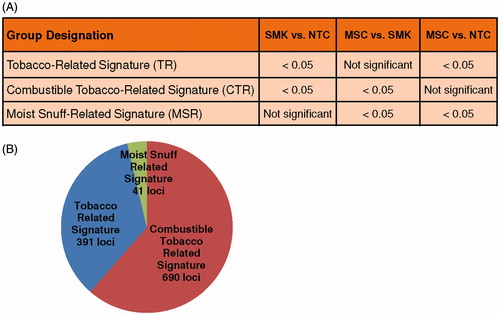
Figure 2. Methylation group example signatures based on beta values. A. Combustible tobacco-related (CTR) signature for cg05575921 (AHRR). B. Tobacco-related (TR) signature for cg04018738 (VARS). C. Moist snuff-related (MSR) signature for cg14895183 (AGAP1).
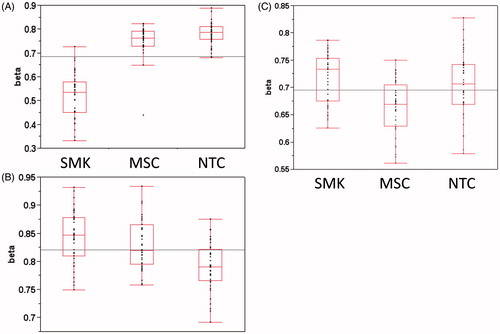
Table 1. List of CTR and TR top hits with more than one locus altered for each signature.
Figure 3. Six of seven AHRR loci are significantly hypo-methylated in the SMK cohort.
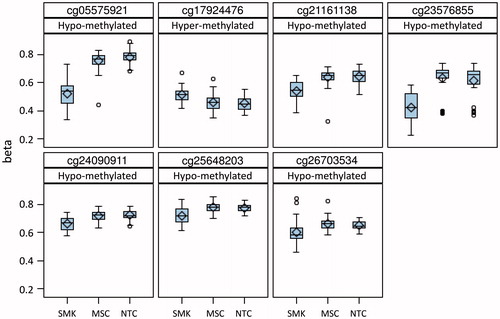
Figure 4. Top 50 loci with the most significant adjusted p values cluster into two groups. The majority of NTC (green; 80%) and MSC (blue; 63%) samples co-cluster to the right side of the heat map (circled in black), while the majority of SMK (red; 68%) samples cluster to the left. Coloured heat map regions indicate methylation changes: hypo-methylation (green) and hyper-methylation (red).
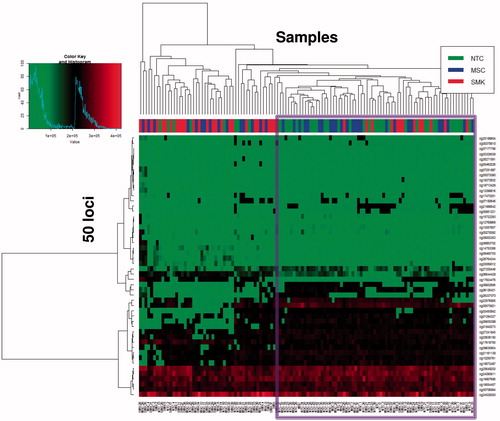
Table 2. CTR network analysis summary.
Table 3. MSR network analysis summary table.
Table 4. TR network analysis summary table.