Figures & data
Figure 1. Flow diagram of the participants in the study.
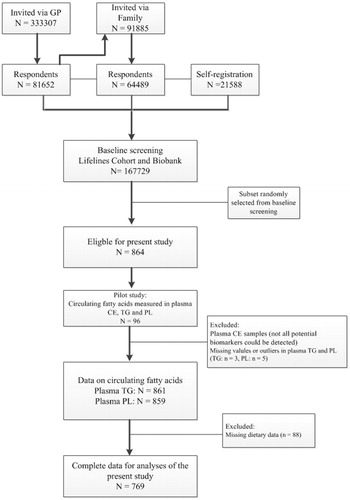
Table 1. Baseline characteristics of the Lifelines population.
Table 2. Univariate regression analyses and multivariate models to predict dairy fat with circulating fatty acids in plasma TG, plasma PL and a combination of the two in the Lifelines Cohort.
Table 3. Multivariate models to predict dairy fat with circulating fatty acids in plasma TG, plasma PL and a combination of the two in the Lifelines Cohort based on 1000 bootstraps.
Figure 2. Bland-Altman plots for the agreement between the observed intake (FFQ-derived) and the estimated intake (based on the best circulating fatty acids in plasma TG) for the measurement of dairy fat intake in the general population. Plots of the differences between the observed intake (FFQ-derived) and the estimated intake (based on the best circulating fatty acids in plasma TG) vs the mean of the observed intake (FFQ-derived) and the estimated intake (based on the best circulating fatty acids in plasma TG) method, with (a) representing C15:0 and (b) Trans-C18:1(n-7) as the estimated intake. The red line displays the mean of the difference. The black dotted lines represents the limits of agreement (lower limit: mean - SD*1.96; upper limit: mean + SD*1.96). C15:0: Pentadecanoic acid; FFQ: food frequency questionnaire; SD: standard deviation; TG: triglycerides; Trans-C18:1(n-7): Vaccenic acid.
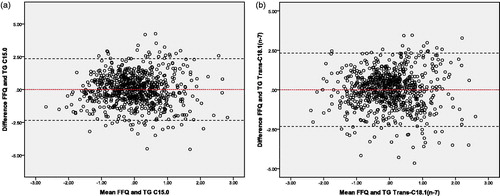
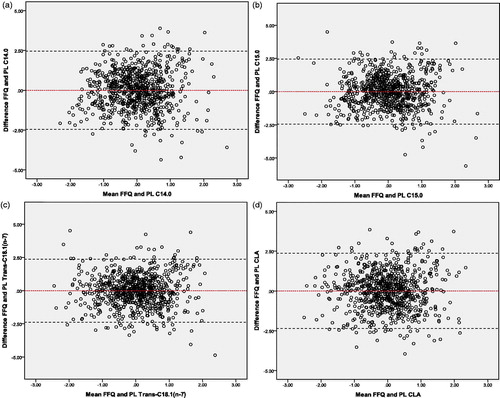
Figure 3. Bland-Altman plots for the agreement between the observed intake (FFQ-derived) and the estimated intake (based on the best circulating fatty acids in plasma PL) for the measurement of dairy fat intake in the general population. Plots of the differences between the observed intake (FFQ-derived) and the estimated intake (based on the best circulating fatty acids in plasma PL) vs the mean of the observed intake (FFQ-derived) and the estimated intake (based on the best circulating fatty acids in plasma PL), with (a) representing C14:0, (b) C15:0, (c) Trans-C18:1(n-7) and (d) CLA as the estimated intake. The red line displays the mean of the difference. The black dotted lines represents the limits of agreement (lower limit: mean - SD*1.96; upper limit: mean + SD*1.96). C14:0: Myristic acid; C15:0: Pentadecanoic acid; CLA: Conjugated Linoleic; FFQ: food frequency questionnaire; PL: phospholipids; SD: standard deviation; Trans-C18:1(n-7): Vaccenic acid.