Figures & data
CONSORT flow diagram: The phases of the study.*Two subjects in the NS group were discontinued prematurely based on the investigator's judgment because a clinically significant incident or disease occurred on days 6 and 11, respectively. **CHC data in Study 2 was not used in this combined analysis.
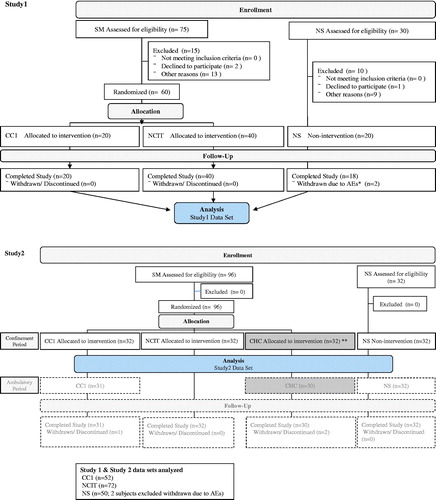
Table 1. Demographics and baseline characteristics at screening, according to group.
Table 2. Carboxyhemoglobin and plasma cotinine, according to group.
Table 3. Hematology biomarkers and biomarkers related to cardiovascular diseases (Arithmetic means [SE] for baseline).
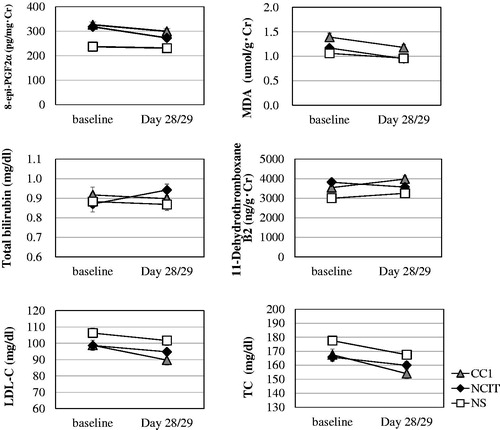
Table 4. Hematology biomarkers and biomarkers related to cardiovascular diseases, according to group (Arithmetic means [SE] for baseline and Day 28/29).
Figure 1. Biomarkers related to cardiovascular diseases according to group (mean ± SE). CC1: smoke 1 mg ISO tar conventional cigarette; NCIT: use noncombustion inhaler type of tobacco product; NS: nonsmokers; SE: standard error.