
Figures & data
Figure 1. Flow chart of study participants.
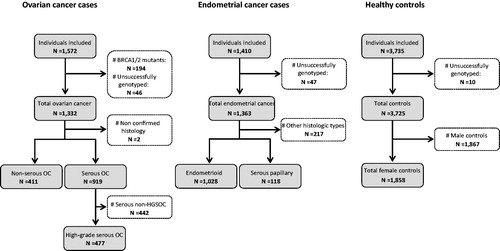
Table 1. MDM2 SNP55 genotype distribution and risk estimates for ovarian and endometrial cancer.
Figure 2. Impact of MDM2 SNP55 on ovarian and endometrial cancers risk. Forest plots illustrating the effect (odds ratio; OR) of SNP55 (dominant model) on risk of ovarian- and endometrial cancer in (A) overall cancer patients and (B) in patients harbouring the MDM2 SNP309TT genotype. Dot size indicate sample size (number of cases) and horizontal whiskers indicate 95% confidence interval for the OR estimate.
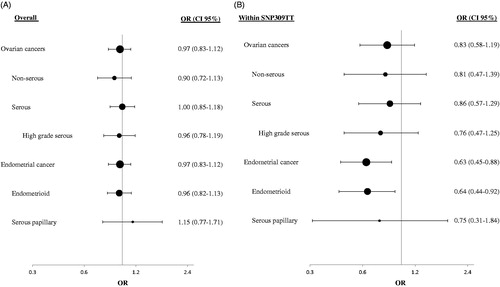
Table 2. MDM2 SNP55 genotype distribution among carriers of the SNP309TT and TG genotypes.
Supplemental material