
Figures & data
Figure 1. (A) IL-1β secretion by HaCaT cells after exposure to cobalt chloride concentrations 0, 100, 500 µM and 1 mM. Exposure time is 30 minutes (control), 24 hours, and 48 hours. Calcium incubation of HaCaT cells (high: 1.8 mM and low: 0.15 mM) calcium concentrations are shown. (B) IL-18 secretion production by HaCaT-cells after CoCl2 exposure 0, 100, 500 µM and 1 mM, at time points 30 minutes, 24 hours, and 48 hours. Results of high (1.8 mM) and low (0.15 mM) calcium culturing conditions are shown.
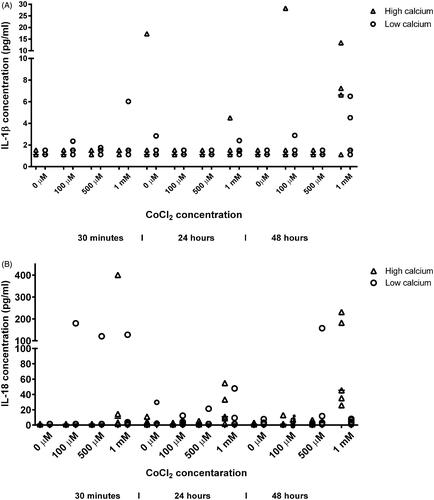
Figure 2. Gene expression in HaCaT cells after CoCl2 exposure of 0, 500 µM and 1 mM for 24 hours and 48 hours, respectively. High (1.8 mM) and low (0.15 mM) calcium culturing conditions are shown. Results are presented as the normalized gene expression for each of IL1B (A), IL18 (B), NLRP3 (C), CASP1 (D), and PYCARD (E). Results are shown as median value and range (min-max).
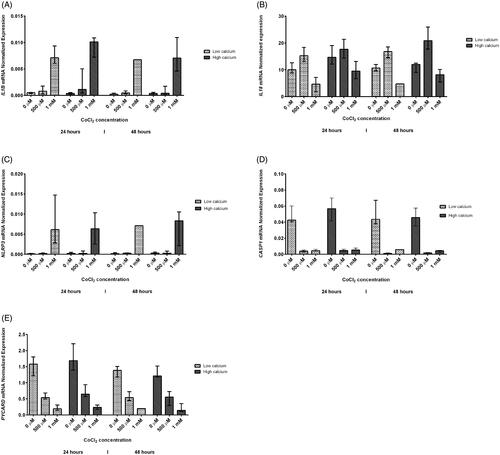
Figure 3. Caspase-1 activity in HaCaT cells determined with FLICA staining, analysed by flow cytometry. The cells were exposed to 500 µM and 1 mM CoCl2, respectively, for 24 hours under high and low calcium incubation. The results are expressed in percentage as fluorescence signal of the activated caspase-1 in exposed cells, compared to unexposed, and shown as mean value and standard deviation (*p ≤ 0.05, **p ≤ 0.005).
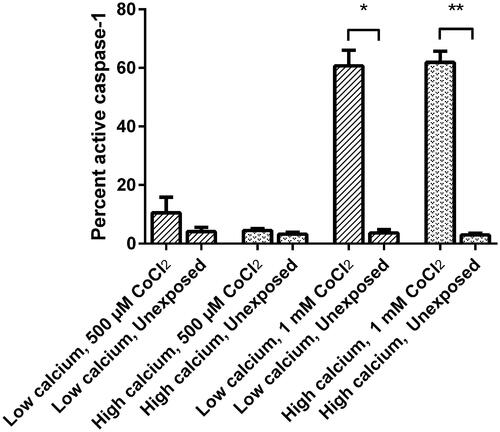
Figure 4. Caspase-1 activity in HaCaT cells determined by flow cytometry. Gating strategy for the cell population (A). By moving forward with the same population, gating strategy is shown using unstimulated (0 µg) stained cells (B), and the gating of FLICA positive cells (C).
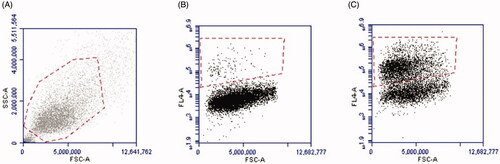
Table 1. ANOVA analyses for dose- and time trends for IL-1β and IL-18 secretion from the HaCaT cellsa,b.
Table 2. Linear regression mixed model analyses for dose- and time trends for IL-1β and IL-18 secretion from the HaCaT cellsa,b.
Table 3. Linear regression mixed model analyses for caspase-1 activation in HaCaT cells, dose trends, high (1.8 mM) and low (0.15 mM) calcium incubationa,b.
Table 4. ANOVA analyses showing dose- and time relationships for gene expression of IL1B, IL18, NLRP3, CASP1 and PYCARD at high (1.8 mM) and low (0.15 mM) calcium incubation of HaCaT cells exposed to CoCl2a,b.
Table 5. Linear regression mixed model analyses showing dose- and time relationships for gene expression of IL1B, IL18, NLRP3, CASP1, and PYCARD at high (1.8 mM) and low (0.15 mM) calcium incubation of HaCaT cells exposed to CoCl2a,b.
Data availability statement
All data are within the manuscript.