
Figures & data
Figure 1. Flow diagram of patients included in this study. CLD, chronic liver disease; HCC, hepatocellular carcinoma.
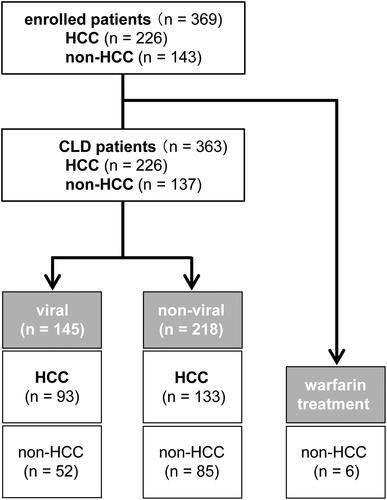
Table 1. Patient characteristics in the viral and non-viral groups.
Figure 2. A. Comparison of serum PKCδ, AFP, and DCP levels in viral CLD (upper) and non-viral CLD (lower) patients with or without HCC. Serum PKCδ was significantly higher in HCC patients in both the viral and the non-viral groups. (HCC vs. non-HCC; P < 0.001 for both). B. Comparison of serum PKCδ, AFP, and DCP levels in HCC patients between the viral and non-viral groups. PKCδ and AFP levels in HCC patients were not significantly different between the viral and non-viral groups, but DCP levels in non-viral HCC were higher than those in viral HCC. The bold line through the middle of each plot represents the median.
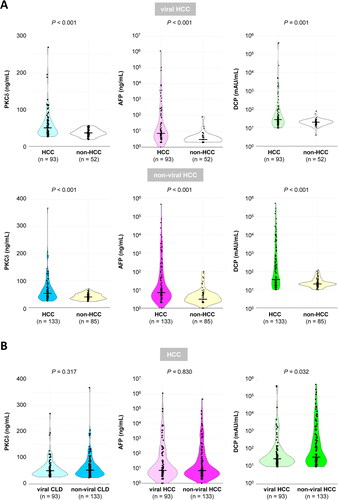
Table 2. Factors [age, gender, log(AFP), log(DCP), and PKCδ] associated with HCC in multiple logistic regression analyses.
Figure 3. Diagnostic performances for HCC. ROC curves for comparisons with the addition of serum PKCδ based on (A) age and gender or (B) age, gender, log(AFP), and log(DCP). The addition of serum PKCδ significantly improved the diagnostic performances for HCC in both the viral and non-viral groups.
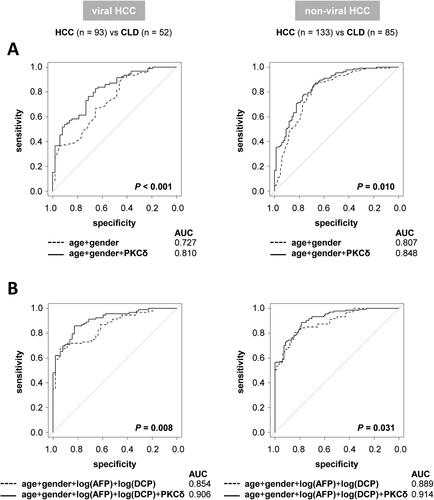
Figure 4. Positive patterns of tumour markers in patients with viral HCC (left) and non-viral HCC (right) are shown. The cut-off values for each marker were 57.7 ng/mL for PKCδ, 20.0 ng/mL for AFP, and 40.0 mAU/mL for DCP.
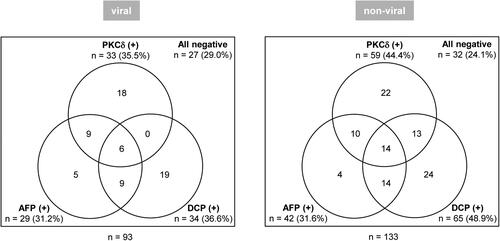
Table 3. Diagnostic performance of PKCδ, AFP, and DCP for viral or non-viral HCC.
Figure 5. A. Comparison of serum PKCδ, AFP, and DCP levels between HCV-related CLD patients with and without HCC. All markers were significantly higher in HCC patients than in non-HCC patients. (P < 0.001, < 0.001, and = 0.040, for PKCδ, AFP, and DCP, respectively). B. Comparison of serum PKCδ, AFP, and DCP levels in HCV-related HCC patients with (SVR) or without (non-SVR) virus elimination. The median levels of PKCδ, AFP, and DCP in SVR-HCC and non-SVR-HCC were 48.9 vs. 58.0 ng/mL (P = 0.256), 6.6 vs. 29.5 ng/mL (P = 0.024), and 24.5 vs. 38.0 mAU/mL (P = 0.213), respectively. Thus, only AFP levels were significantly lower in SVR-HCC than in non-SVR-HCC. The bold line through the middle of each plot represents the median.
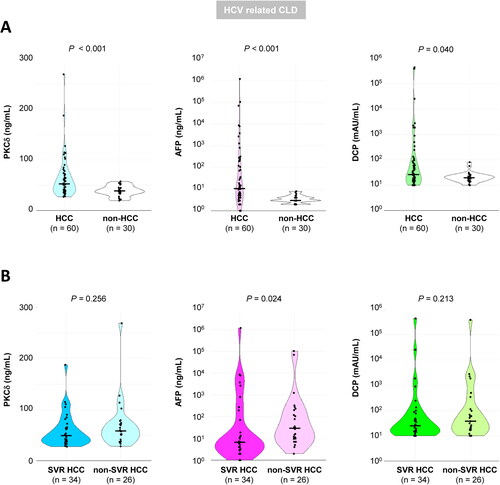
Table 4. Diagnostic performances of PKCδ, AFP, and DCP for post-SVR and non-SVR HCC.
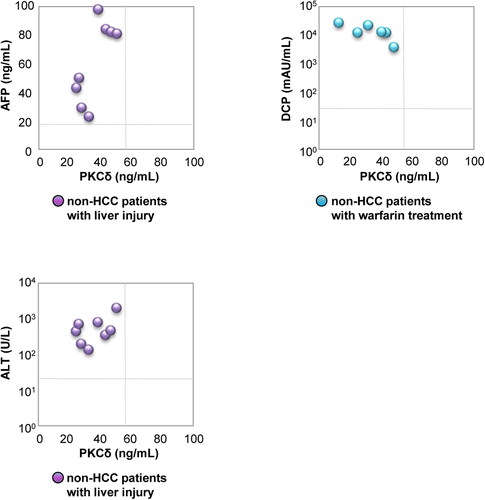
Figure 6. Correlations between serum PKCδ and parameters (AFP or DCP or ALT) in non-HCC patients with liver injury or warfarin treatment are shown. The cut-off values for each marker were 57.7 ng/mL for PKCδ, 20.0 ng/mL for AFP, 40.0 mAU/mL for DCP, and 30.0 U/L for ALT.
Supplemental Material
Download MS Word (1.1 MB)Data availability statement
Data, analytical methods, and research materials are not available for public access; however, these could be requested directly from the corresponding authors.