
Figures & data
Figure 1. Analysis of RT-qPCR products of circulating tRFs obtained by the miR-Q approach. (A) Products for tRNA-Gly-GCC, CCC 5′ end and full-length tRNA-Gly-GCC, CCC analysed by agarose gel electrophoresis. Lane 1: RT-qPCR product generated with primers for 5′ end of tRNA-Gly. Lane 2: minus cDNA control with primers for 5′ end. Lane 3: PCR markers; size in base pairs indicated on the left. Lane 4: RT-qPCR product generated with primers for full-length tRNA-Gly. Lane 5: minus cDNA control with primers specific for full-length tRNA. (B) Products for the 5′ ends of tRNA-Glu-CTC and tRNA-Val-CAC, AAC analysed by agarose gel electrophoresis. Like in a products obtained in the presence and absence of cDNA were analysed. The expected sizes for the miR-Q products (indicated by arrows) are 89 base pairs for tRNA-Gly and 94 base pairs for tRNA-Glu and tRNA-Val.
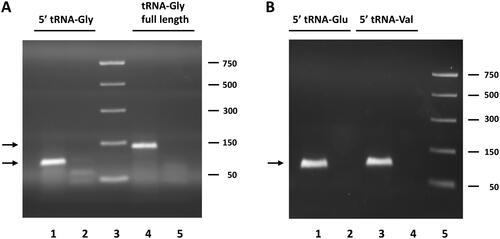
Figure 2. Circulating tRF levels in patient and control sera. (A–C) Results of miR-Q quantification of 5′-ends of tRNA-Gly-GCC,CCC (a), tRNA-Glu-CTC (B) and tRNA-Val-CAC,AAC (C) in sera from patients with PsA or RA and in sera of healthy subjects (CTR). (D) Results of similar analyses for the 5′ end of hY4 RNA. Mann–Whitney two-sample tests were performed to examine the differences between different groups (*p < 0.05; **p < 0.01; ***p < 0.001).
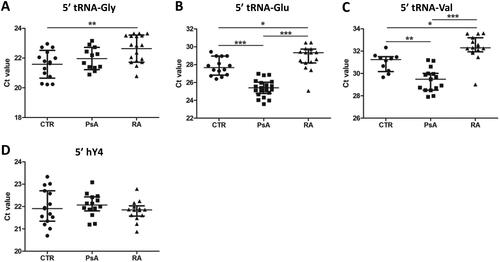
Figure 3. Negative correlation between tRF levels and age in PsA patients. Spearman’s correlation analysis revealed weak correlations between the levels of circulating 5′ fragments of (A) tRNA-Glu-CTC and (B) tRNA-Val-CAC-AAC and age (in years) in patients with PsA.
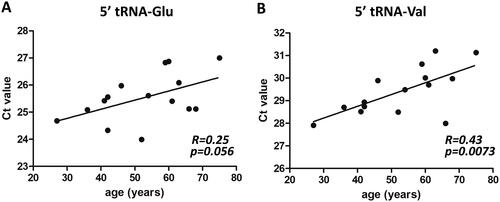
Figure 4. Levels of extracellular tRFs in sera of IL1Ra knock-out mice. Small RNAs were isolated from sera of wild type (WT) and IL1Ra deficient mice (IL-1Ra−/−) and the levels of tRFs were determined by the miR-Q approach using tRNA-specific primers. Mann–Whitney two-sample tests were performed to examine the differences between different groups (*p < 0.05).
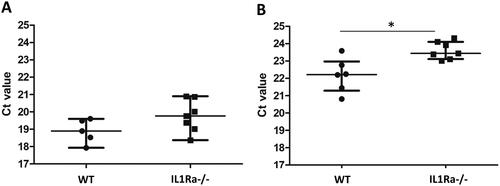
Figure 5. Relative fractions of monocytes, T cells and NK cell in whole blood from RA and PsA patients and healthy individuals. The microarray datasets GSE15573 and GSE61281 were used for the analysis of gene expression profiles and cell fractions. Monocyte, T cell and NK cell fractions were determined for each sample using CIBERSORT.
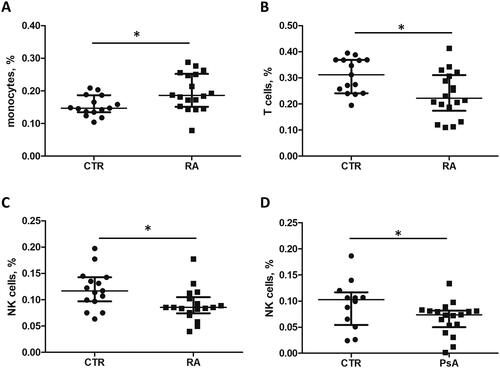
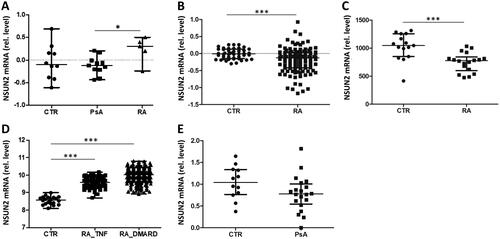
Figure 6. Expression levels of NSUN2 in RA and PsA patients and in healthy individuals. (A) RT-qPCR analysis was used to analyse NSUN2 expression in PBMCs from CTR individuals and from patients with PsA and RA. (B–E) Microarray datasets GSE17755 (B), GSE15573 (C), GSE45291 (D) and GSE61281 (E) were used to quantify relative NSUN2 expression levels in whole blood (GSE17755, GSE45291, GSE61281) or PBMCs (GSE15573) of the same patient and control groups. RA_TNF and RA_DMARD indicate RA subgroups characterized by inadequate responses to anti-TNFα and DMARD treatment, respectively. Mann–Whitney two-sample tests were performed to examine the differences between different groups (*p < 0.05; **p < 0.01; ***p < 0.001).
Supplemental Material
Download MS Word (734 KB)Data availability statement
The data that support the findings of this study are available from the corresponding author, GJMP, upon reasonable request.