Figures & data
Figure 1. New York City land surface temperature (LST) and COVID-19 mapped for combined Waves 1 and 2, and graph of COVID-19 case counts showing Waves 1, 2 and 3 from February 2020 to February 2022. COVID-19 waves are defined as the periods between days with no change in 7-day case counts.
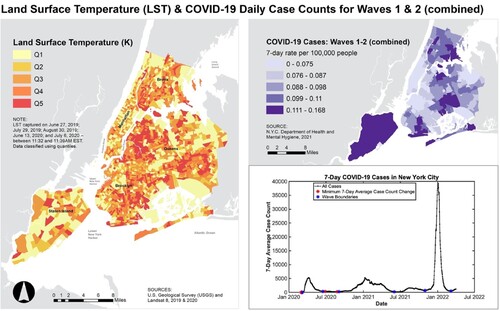
Table 1. Timeline of COVID-19 waves and interventions in New York City.
Table 2. Ordinary least squares regression of LST heat and built and social factors.
Table 3. Multiple multivariate regression analysis of heat, vegetation density and impervious surface.
Figure 2. New York City key neighbourhoods of risk and distance to major open space, with vegetation density and impervious surface mapped in quintiles (Q1 lowest effect to Q5 highest effect)
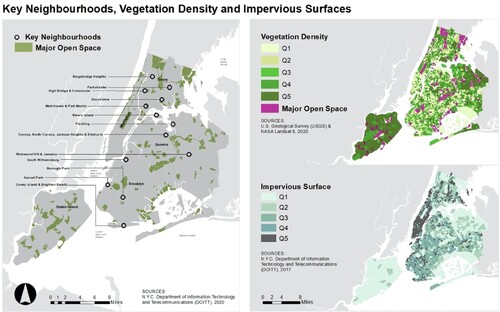
Table 4. Multiple multivariate regression analysis of COVID-19 across three waves.
Figure 3. COVID-19 Wave 1 mapped with distance to cooling infrastructure and percent of population in each census tract that lacks AC
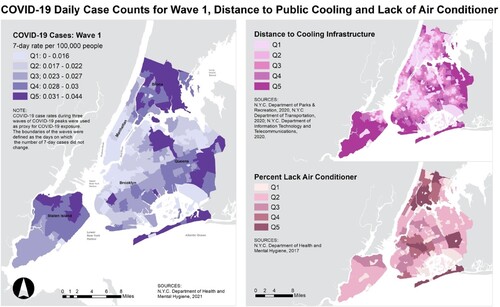
Figure 4. Distance to green space mapped with the social vulnerability scale as represented in quintiles. Hatched overlays indicate census tracts that have both the highest quintile case rates and temperature.
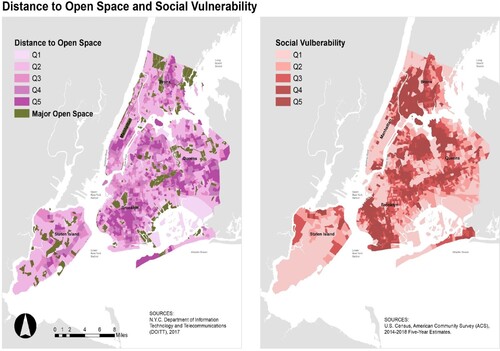
Figure 5. COVID-19 Waves 1 and 2 combined mapped in comparison to Wave 1 and Wave 2.
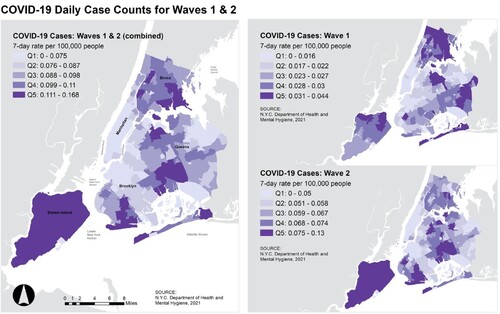
Figure 6. COVID-19 Wave 1 and Wave 2 mapped in comparison to census data on Percent Black or African American and Percent Hispanic residents in each census tract.
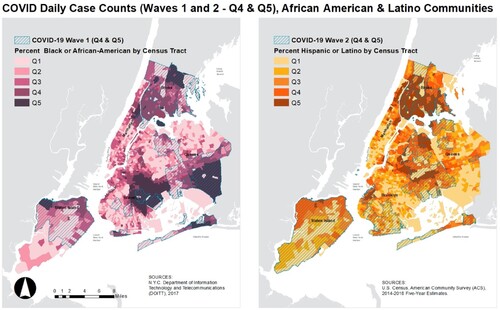
Figure 7. COVID-19 Wave 1 and Wave 2 mapped in comparison to rental overcrowding and mixed density in each census tract.
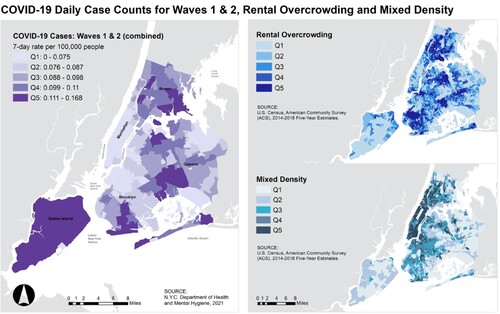
Figure 8. COVID-19 Wave 3 mapped in quintiles with highest quintile of compound risk index in hashed red overlay.
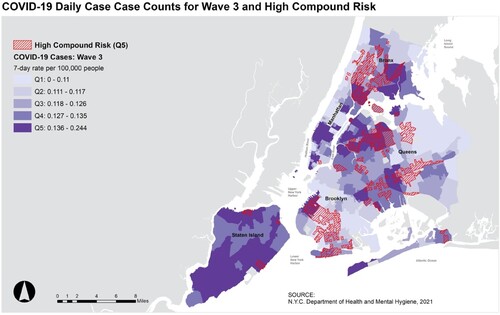
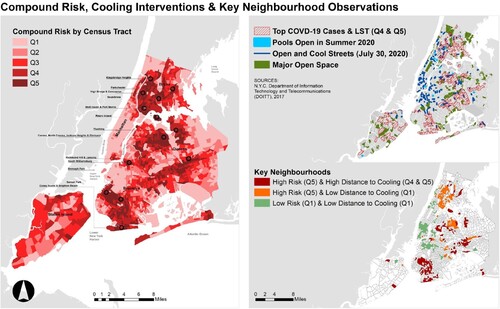
Figure 9. Compound risk map showing the overlap of high temperature, COVID-19 case rates across Waves 1 and 2, rental crowding and social vulnerability; NYC interventions including open and cool streets, pools open in summer 2020 and major open space; key high-risk and low-risk neighbourhoods and high and low distance to cooling centers.