
Figures & data
Figure 1. Circularity discourse typology (adapted from Calisto Friant, Vermeulen, and Salomone Citation2020).
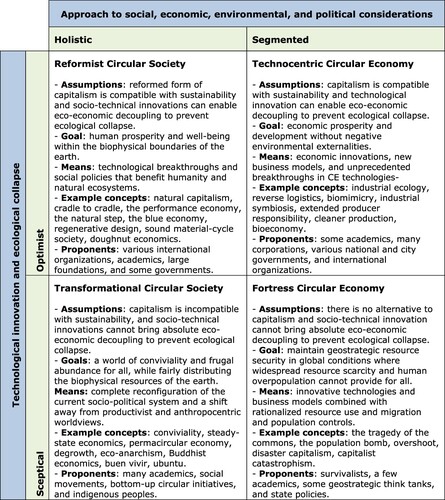
Figure 2. Methodological steps.
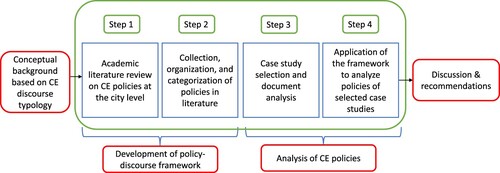
Table 1. Search terms used to identify the relevant articles.
Table 2. Policy areas identified in the literature review.
Table 3. Data sources for policy analysis and policy-discourse framework.
Table 4. Summarised policy-discourse framework.
Table 5. Assessment scale for policy-discourse framework.
Table 6. Number of policies per policy area and the total number of points available.
Table 7. Number of policies per discourse type and total number of points available.
Figure 3. Policy areas addressed in Amsterdam’s CE strategy.
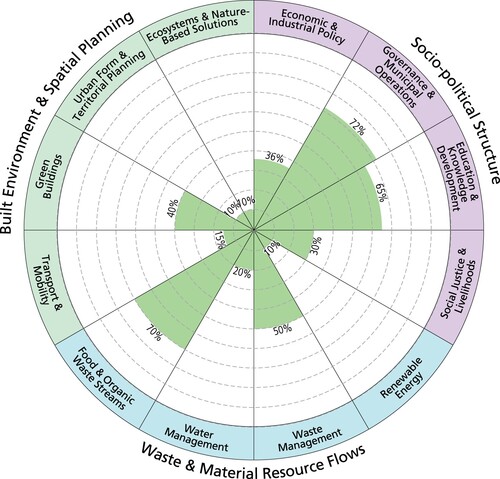
Figure 4. Presence of the four circularity discourse types in Amsterdam.
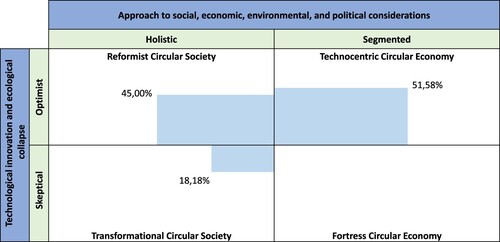
Figure 5. Policy areas addressed within Glasgow’s CE route map.
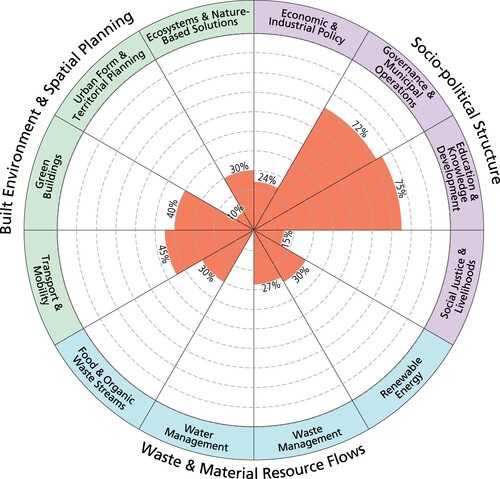
Figure 6. Presence of the four circularity discourse types in Glasgow.
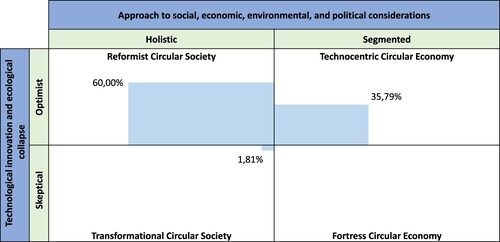
Figure 7. Policy areas addressed within Copenhagen’s CE plan.
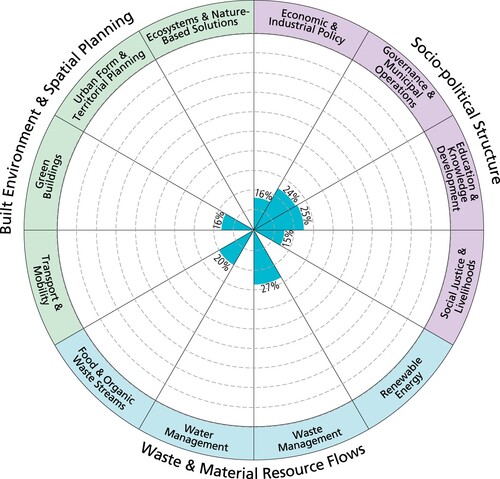
Figure 8. Presence of the four circularity discourse types in Copenhagen.
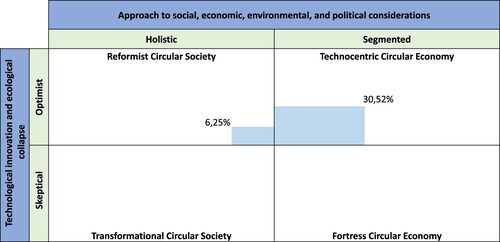
Figure 9. Comparative visualisation of the policy areas addressed in the three cities’ CE strategies.
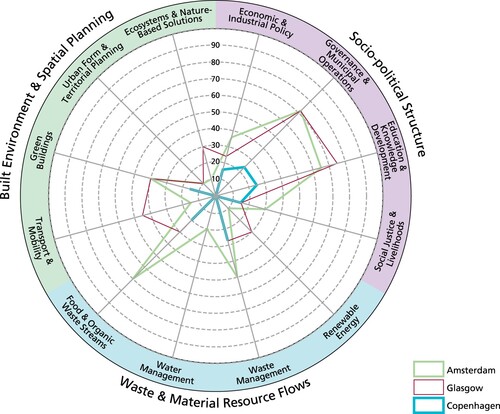
Table 8. Summary of results in the 3 policy categories and 12 policy areas for the 3 case studies.
Table 9. Summary of policy recommendations.