
Figures & data
Figure 1. Examples of sections from three local government community garden policies and the respective code to which each section was assigned.
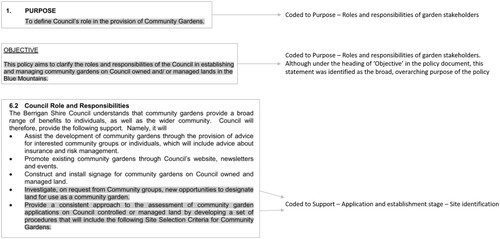
Figure 2. Summary of the number of community garden policies from all New South Wales (NSW) and Victorian local governments (LGs), by state, and by geographical classification. Percentages are displayed as the proportion of the number of LGs with a policy from that division of the sample, i.e. n = 28 NSW LGs is equivalent to 22% of all (128) NSW LGs (not of the total sample); n = 19 metropolitan NSW LGs is equivalent to 56% of the 34 metropolitan LGs in NSW.
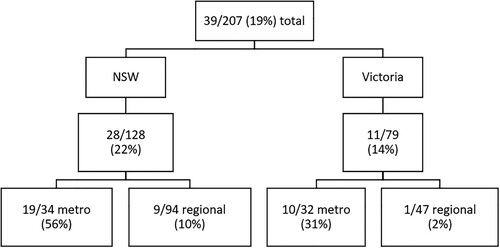
Table 1. Local government departments involved in/responsible for community garden policy implementation.
Supplemental material