
Figures & data
Figure 1. Color orientation 3D-tractography reconstruction of the arcuate fascicle. The patent´s right-left asymmetry evidence a shorter tract and a lower amount of nerve fibers on the left side.
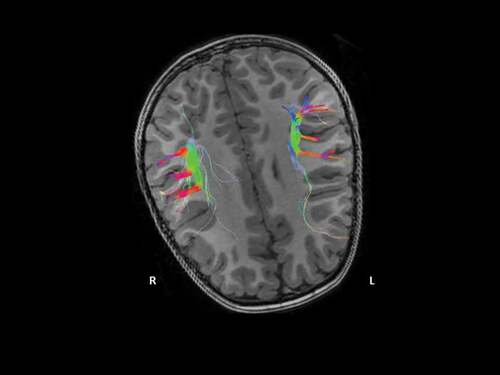
Figure 2. Color-code perfusion map with the pulsed-ASL sequence. Decreased cortical blood flow in the patient´s left cerebellar hemisphere.
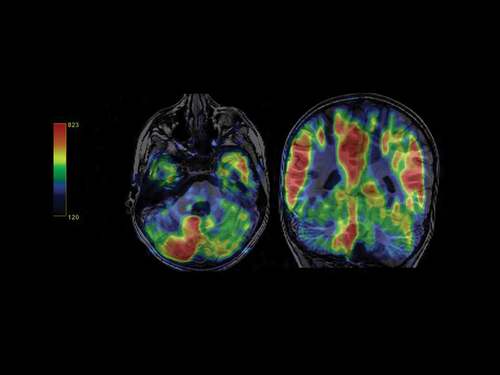
Figure 3. Illustration of the COL18A1 variants present in the proband by NGS and sanger sequencing and segregation studies.
A) IGV visualization of the variant COL18A1 ca. 1883_1891dup was evident in the proband and his mother, in both strands (forward in red and reverse in blue), in 26% (24/93) and 25% (16/64) of the reads, respectively. B) IGV visualization of the variant COL18A1 ca. 1787 C > T was evident in the proband and his father, in both strands (forward in red and reverse in blue), in 50% (50/101) and 56% (51/91) of the reads, respectively. C) Segregation studies of the COL18A1 ca. 1883_1891dup variant show its presence in the proband and its absence on the healthy sister (as indicated by the arrows). D) Segregation studies of the COL18A1 ca. 1787 C > T variant show its presence in the proband and in his healthy sister (as indicated by the arrow).
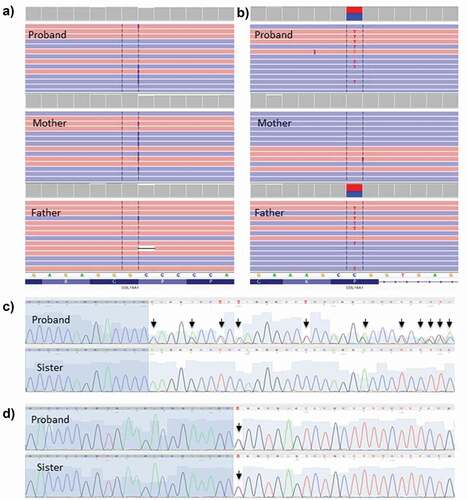
Figure 4. Expression of COL18A1 (total and isoforms) in peripheral blood leukocytes.
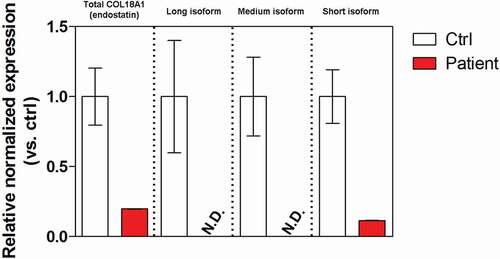
Table 1. Neuroimaging findings in patients with biallelic COL18A1 mutations. * Cases with anomalies in brain MRI (only cases with performed and available results)