
Figures & data
Figure 1. Korso school, perspective drawing and facades 1:750. Photo courtesy of Kimmo Nekkula.
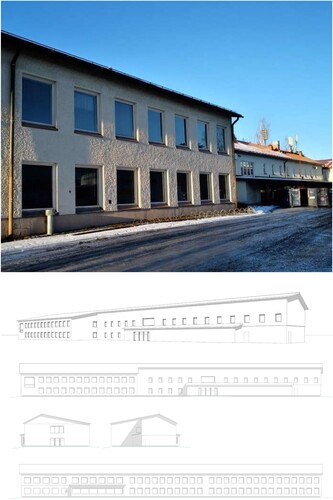
Table 1. Structures used in the scenarios.
Figure 2. Tesoma school, perspective drawing and facades 1:750. Photo courtesy of the authors.
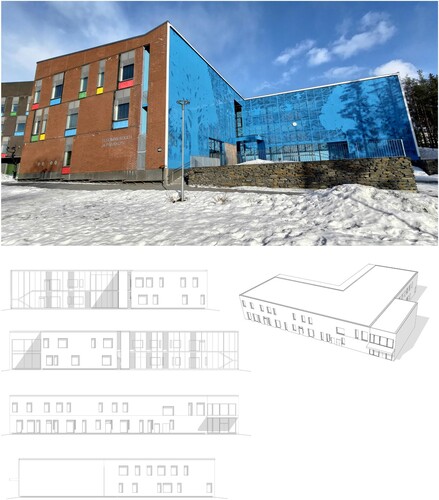
Table 2. Input data for energy calculation.
Figure 3. Scope of LCA. Source: See note 13.
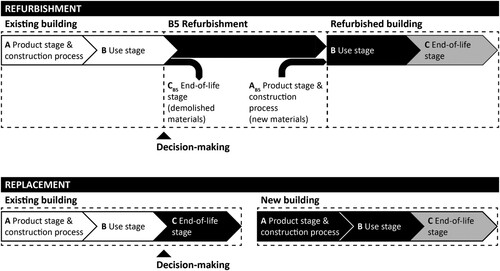
Figure 4. Energy simulation results.
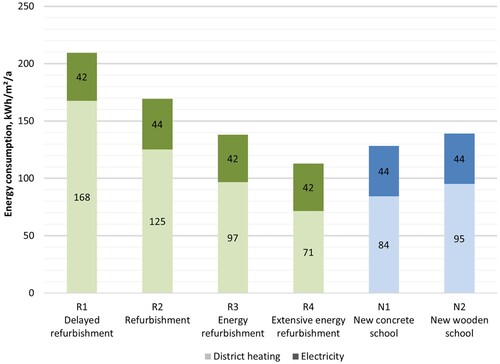
Figure 5. Life cycle phases, data sources and tabulated values used. Notes: A5 or C values are not available for refurbishment works in the MoE method. Thus, the method’s A5 value for new construction was used for R2–R4. This is likely an exaggeration, so it was assumed that the value compensates for CB5 as well, and a value for CB5 was not estimated separately.
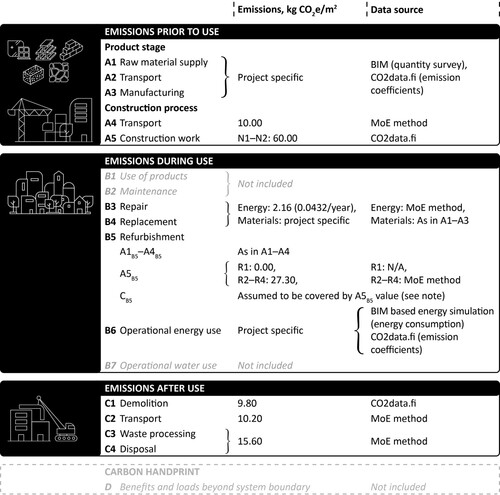
Figure 6. Accumulation of emissions during different life cycle stages.
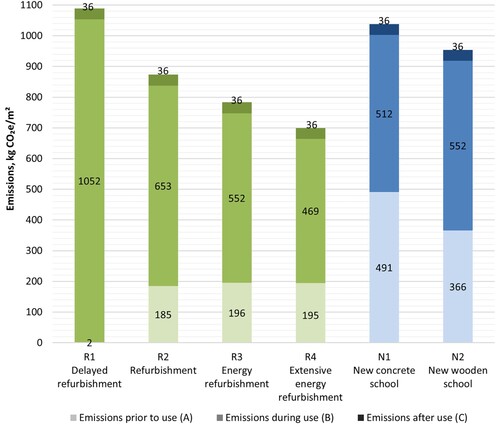
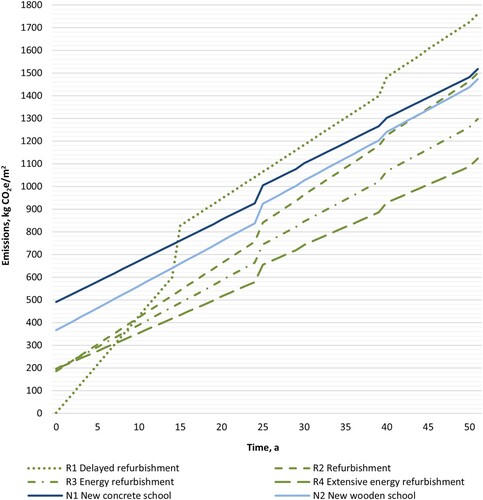
Figure 7. Accumulation of emissions in the different refurbishment and replacement scenarios.
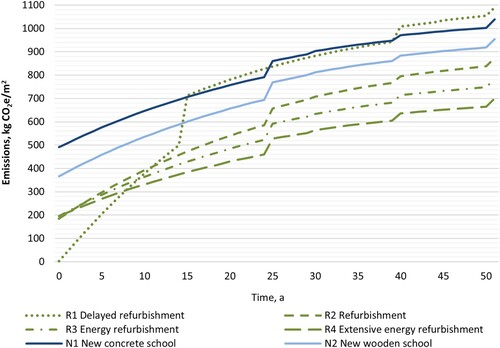
Figure 8. Accumulation of emissions when +10% to electricity consumption and +50% to district heating consumption is assumed. Compare to .
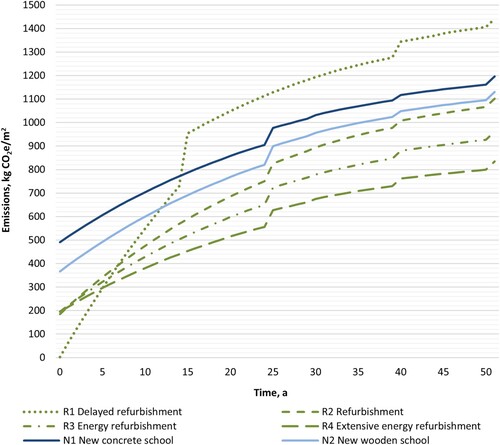
Figure 9. Accumulation of emissions when no decarbonization is assumed for energy production. Compare to .
Input_data
Download MS Excel (68.3 KB)Data availability statement
The data that support the findings of this study are available in the tables and figures of the article, the supplementary data file, and Open Access sources (emissions coefficients and tabulated values in the MoE method or the CO2data.fi database).