
Figures & data
Table 1. Interview states and years.
Table 2. Weighted sample characteristics, by race/ethnicity and sexual orientation (n = 372,766).
Figure 1. Healthcare satisfaction (percentage) by race/ethnicity, sexual orientation and gender.
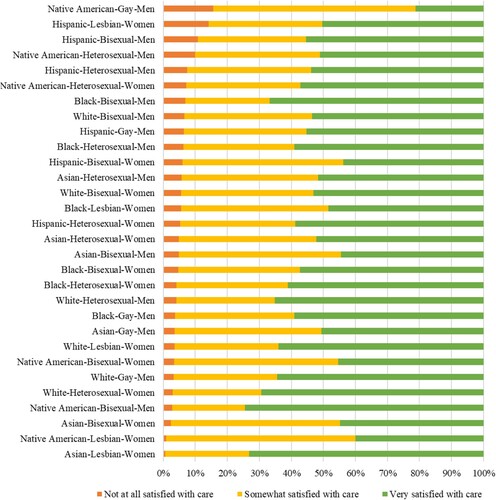
Table 3. Odds ratios from ordered logistic regression models predicting healthcare satisfaction (n = 372,766).
Figure 2. Adjusted Predicted Probabilities and 95% CIs for Lowest Satisfaction by Race/ethnicity.
Note: (1) Letters indicate significant pairwise comparison (all at p<.05) across sexual orientation groups; a = heterosexual, b = gay/lesbian, c = bisexual. (2) Heterosexual, gay and lesbian, and bisexual respondents are abbreviated as ‘Het’, ‘G/L’, and ‘Bi’, respectively, due to spatial limitation.
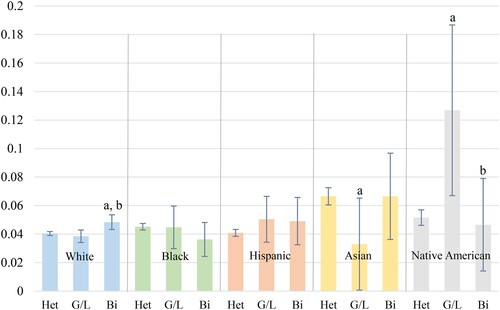
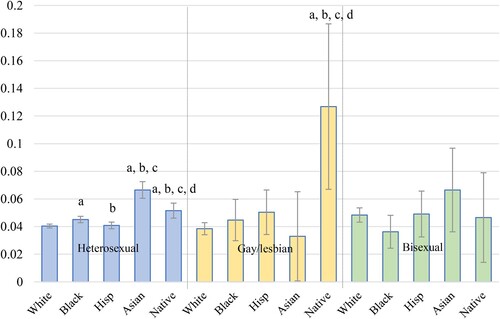
Figure 3. Adjusted Predicted Probabilities and 95% CIs for Lowest Satisfaction by Sexual Orientation.
Note: (1) Letters indicate significant pairwise comparison (all at p < .05) across racial/ethnic groups; a = white, b = black, c = Hispanic, d = Asian. (2) Hispanic and Native American respondents are abbreviated as ‘Hisp’ and ‘Native’, respectively, due to spatial limitation.
Data availability statement
Behavioral Risk Factor Surveillance System survey data are available from the Centers for Disease Control and Prevention (CDC), Atlanta, Georgia: U.S. Department of Health and Human Services, Centers for Disease Control and Prevention (https://www.cdc.gov/brfss/index.html).
