
Figures & data
Figure 1. Patients played by actors in the video-vignettes in the survey.

Figure 2. Flow chart showing participation in the sample process.
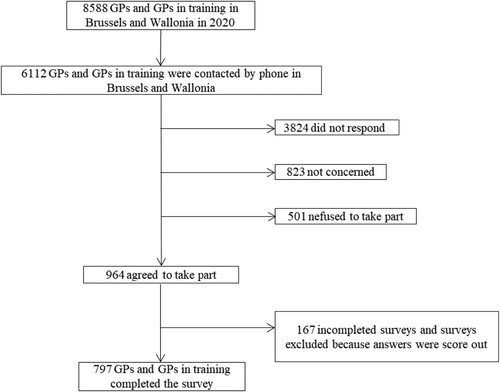
Table 1. Sociodemographic description of the GP respondents according to the patient ethnicity in the video-vignette and statistical test on the random allocation of the video-vignette according to the patient ethnicity, Belgium, n = 797.
Table 2. GPs’ diagnostic decisions, treatment, referral recommendations, and time spent on the vignette.
Table 3. The effect of GPs’ individual, interpersonal, and organizational factors on ethnic differences in mental health diagnosis, treatment, and referral recommendations, estimated coefficients from logistic regression and ANOVA.
