
Figures & data
Table 1. Overview of the patient case, student professions, and patient representatives involved in the IPE workshops.
Table 2. Student demographic details of total post-workshop survey respondents and matched pre- and post-workshop survey respondents.
Figure 1. ICCAS Subscales mean values pre and post Workshop 1 (Young adult with Inflammatory Bowel Disease).
Figure 2. ICCAS Subscales mean values Pre and Post Workshop 2 (Child with type1 diabetes mellitus).
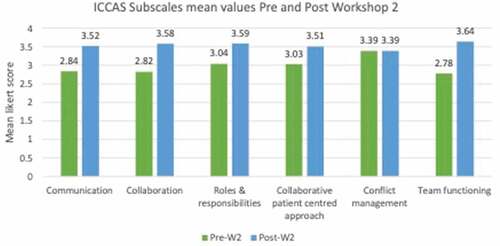
Figure 3. ICCAS Subscales mean values pre and post Workshop 3 (Frail olderadult).
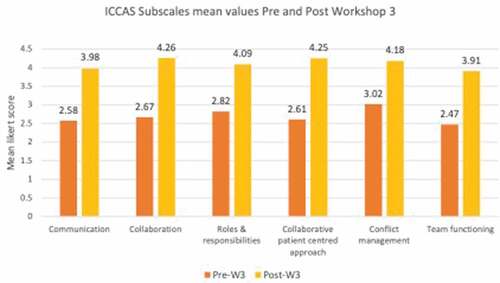
Table 3. ICCAS subscales and individual measures mean scores (and standard deviations) presented for students based on their pre and post first workshop responses (n = 71 students matched pre and post-workshop survey). For those students who attended more than one workshop, only scores pre and post the first workshop attendance are included. (* p < .05).
Table 4. Content analysis of open-ended survey items.