
Figures & data
Table 1. Aspects of learning students valued or wanted to retain or enhance.
Table 2. Students self-reported key learnings from educational and professional experiences.
Table 3. Overview of the palliative care education program.
Table 4. Palliative care interprofessional simulation description.
Table 5. Phase 3 student demographics (n = 62).
Table 6. FATCOD scores for Phase 3 students (pre-program n = 68).
Figure 1. Student self-rating of (a) knowledge and (b) confidence over time.
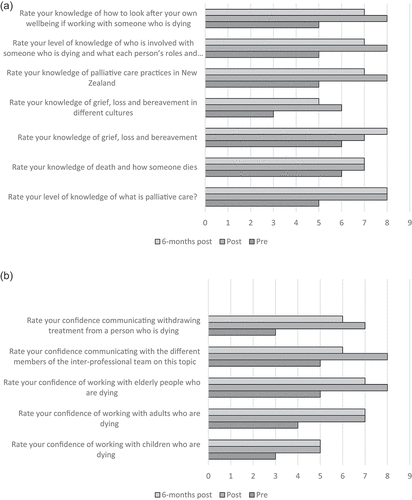
Table 7. Education program feedback from students.