
Figures & data
Figure 1. Diagram illustrating the type and number of participants, their respective teams, the instruments, and additional variables.
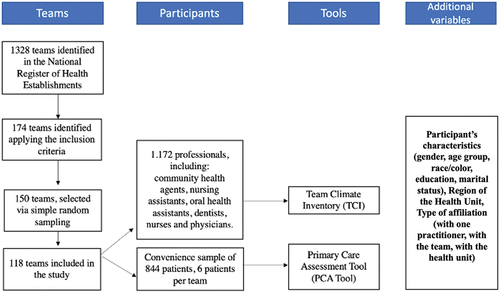
Table 1. Means of the team Climate’s score. São Paulo, 2019.
Table 2. Description of the variables affiliation of the patient and the type of team climate. São Paulo, 2019.
Table 3. Means of PCATool of patients of family health strategy teams. São Paulo, 2019.
Table 4. Results of the multilevel linear models for total PCATool attributes: affiliation, comprehensiveness, and coordination. São Paulo, 2019.
Supplemental material