Figures & data
Table 1. Percentage Employed in Key Sectors by NACE Industry Sector Codes (1974-2018). Source: Quarterly Employment Survey Historical Tables.Footnote9
Figure 1. Comparative Wage Shares, 1960-2020. * Northern Ireland’s wage share is expressed as a percentage of Gross Value Added.Footnote7
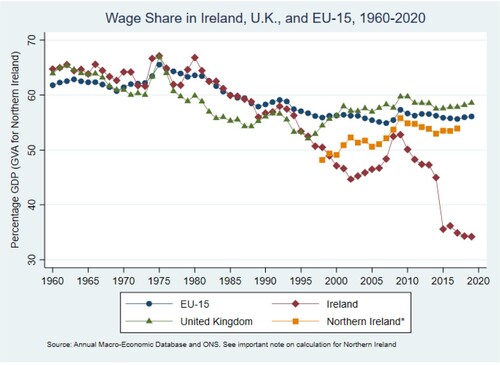
Table 2. Debt to Income Ratio by Country (2015)*.
Table 3. Pre-crisis over-indebtedness thresholds by Income Quintile (2007).
Figure 2. Median Income Difference by Category, Northern Ireland (2017). Source: U.K. Household Longitudinal Survey (Understanding Society).Footnote8
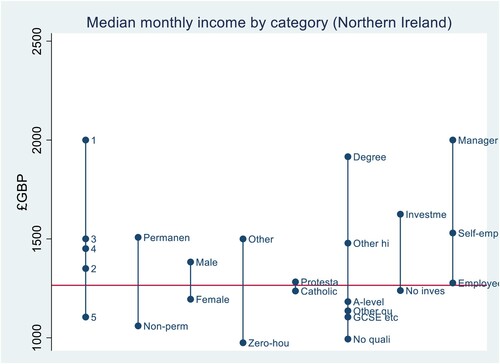
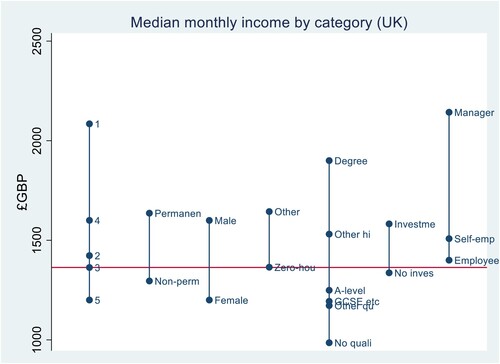
Figure 3. Median Income Difference by Category, United Kingdom (2017). Source: U.K. Household Longitudinal Survey (Understanding Society).