Figures & data
Figure 1. Private landlords in the UK, 1991–2012. Source: British Household Panel and Understanding Society Survey (author’s calculations). *Weighted with ONS mid-year populations to derive absolute numbers. **2009 interpolated due to data gap in Understanding Society Survey
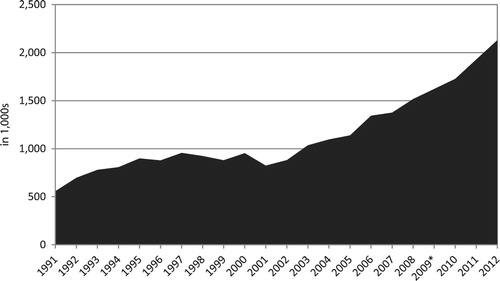
Figure 2. Private landlords among different age cohorts. Source: British Household Panel and Understanding Society Survey (author’s calculations).
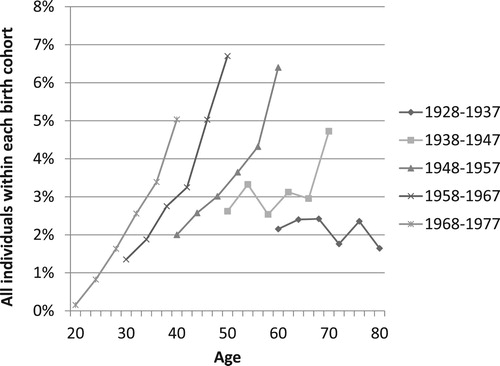
Figure 3. Private landlords by income quintile. Source: British Household Panel and Understanding Society Survey (author’s calculations)
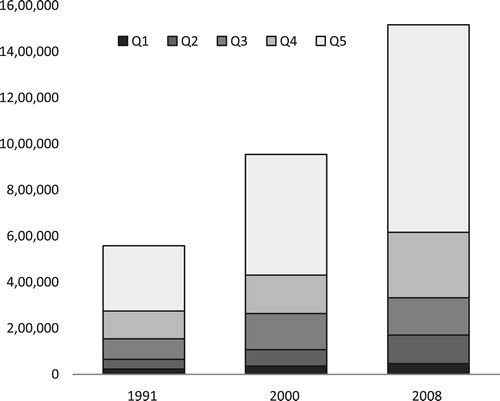
Figure 4. Profiles of private landlords. (a) Tenure status as teenager. (b) Education level. Source: Lord et al. (Citation2013: 16f) (own illustration).
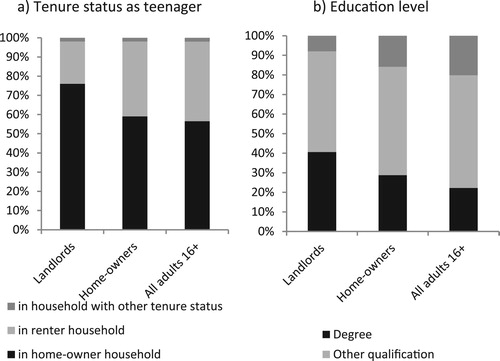
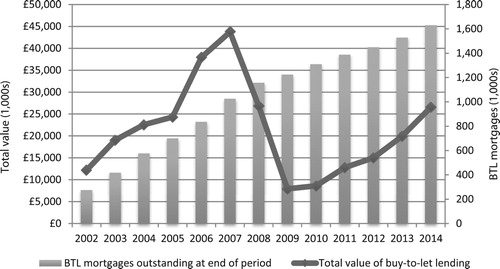
Figure 5. Buy-to-Let Lending 2002–2014. Source: Council of Mortgage Lenders (author’s illustration).