Figures & data
Figure 1. Labour Market Evolution since 1994 (%). Source: authors, based on Stats SA databases and statistics publications.
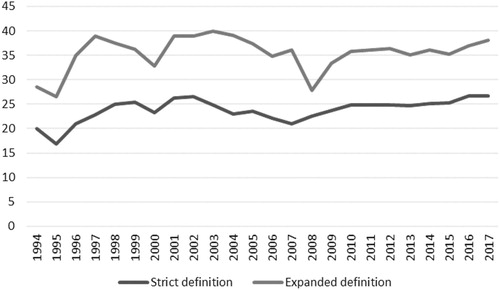
Table 1. October Household survey, 1994–1997: unemployment rates.
Figure 2. Unemployment Rates by Race and Gender (%). Source: October Household Survey, 1995.
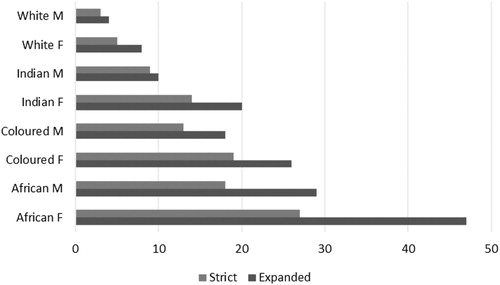
Table 2 Official and Expanded unemployment rates measured by OHS 1994–97, and corollaries.
Table 3. Key labour market indicators, as presented in the first QFLS 2018.
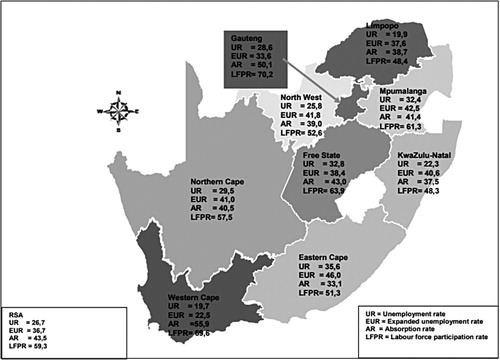
Figure 3. Summary of labour market measures at a glance, Q1: 2018. Source: Stats SA (Citation2018).