Figures & data
Figure 1. International offices of 20 largest exchanges in 2002. Source: annual reports, financial news.
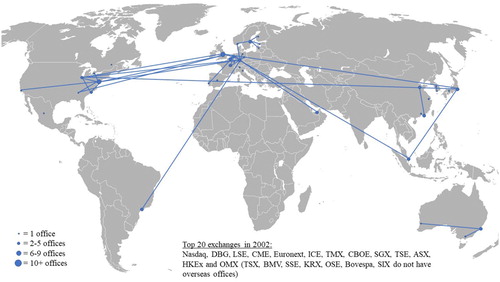
Figure 2. International offices of 20 largest exchanges in 2018. Source: annual reports, financial news.
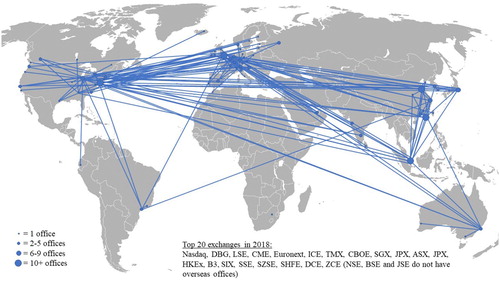
Figure 3. The transformation of exchanges, 1980–2018. Source: annual reports, exchange website information, financial news.
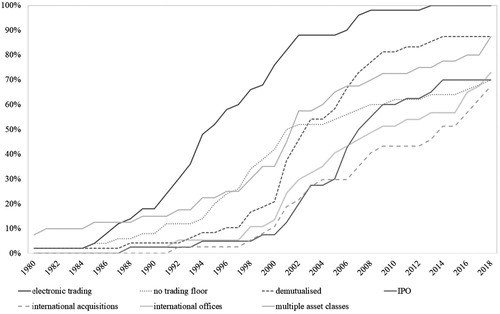
Figure 4. Consolidation in global exchange industry and emergence of global exchange groups, 1990–2018. Source: financial news coverage, annual reports.
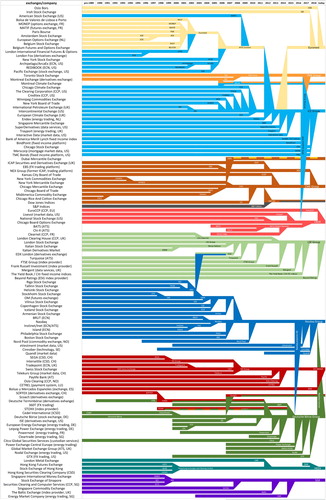
Table 1. Global exchange groups market share in global stock and derivative markets, 2017.
Figure 5. Revenue development of stock exchanges by business segment, 1998–2017. Source: annual reports.
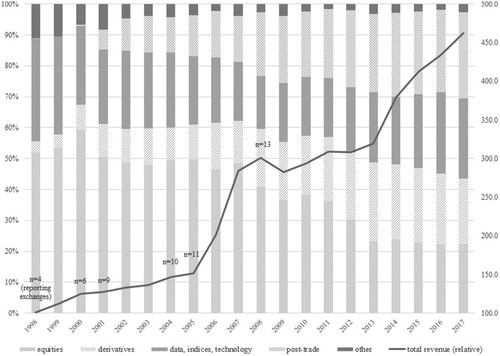
Table 2. The structural power of exchanges through financial infrastructures.
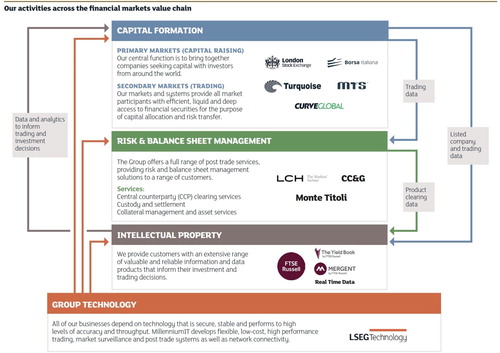
Figure 6. Deutsche Börse Group business model as integrated infrastructure provider, August 2017. Source: investor presentation.
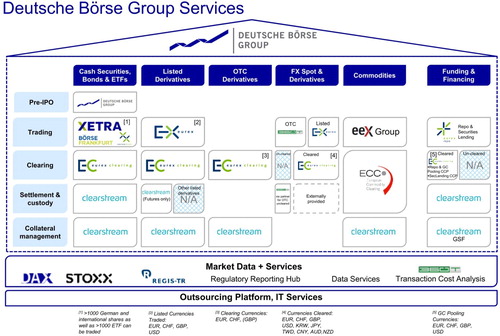
Figure 7. LSE Group business model as integrated infrastructure provider, December 2017. Source: LSE (Citation2017).