Figures & data
Table 1. Simplified Onshore and Offshore Financial System Assets and Liabilities.
Figure 1. China ForEx Reserves (US$ Billion, 1952–1976). Source: Data on Foreign Exchange (ForEx) Reserves are from Xin Zhongguo Wushi Nian Tongji Ziliao Huibian (Citation1999).
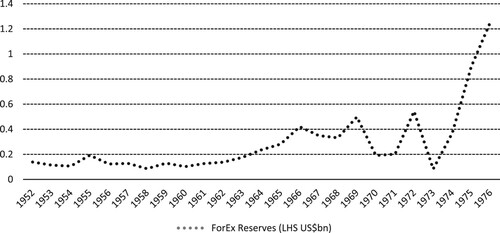
Table 2: Renminbi Deposits, Hong Kong, Selected Indicators (2004–2019).
Table 3. Financial TNCs by Assets and Geographical Spread.
Figure 2. Exchange Rate Indices (RHS) and Offshore Deposits (LHS), 2004–2020. Source: BIS Exchange Rate Database; Hong Kong Monetary Authority.
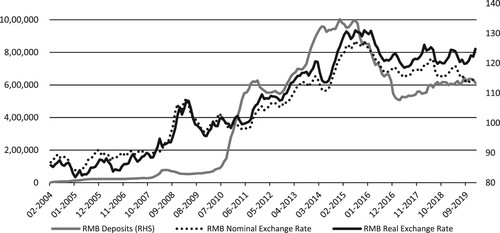
Figure 3. China All and Local Currency Claims of BIS Reporting Banks (US$bn). Notes: International bank claims are the sum of banks’ cross-border claims and their local claims denominated in foreign currencies. Local currency claims include the claims of branches or subsidiaries located in the reporting country whose activities are not consolidated by a controlling parent institution in another reporting country. This mainly comprises banking offices with a non-bank controlling parent institution. BIS, June 2016: 5–6.
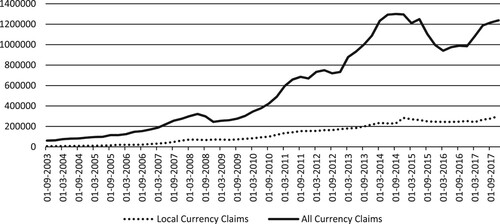
Figure 4. Domestic RMB Financial Assets held by Overseas Entities (100 mill Yuan). Source: Peoples Bank of China, Money & Banking Statistics (货币统计概览) See: http://www.pbc.gov.cn/diaochatongjisi.
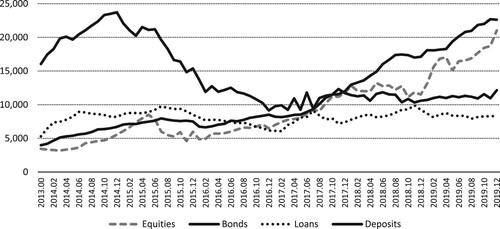
Figure 5. Flows RMB Loans, Foreign Currency Loans and Off-Balance Sheet (RMB, 100mill). Source: Peoples Bank of China, Aggregate Financing to the Real Economy (社会融资规模) http://www.pbc.gov.cn/diaochatongjisi.
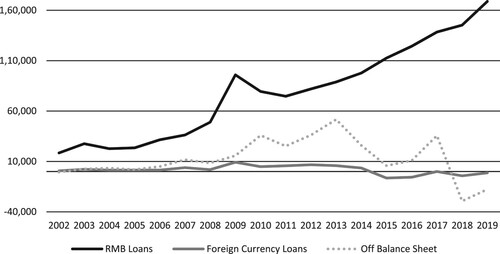
Figure 6. Share of Foreign Banks Claims on NFCs (%) & FDI as a % GDP (2005–18). Source: The share of Foreign Claims on Non-Financial Corporate is calculated using quarterly data from Peoples Bank of China Annual Reports (2005–2017); FDI as a % of GDP calculated using quarterly data from the State Administration of Foreign Exchange http://www.safe.gov.cn/en/DataandStatistics/.
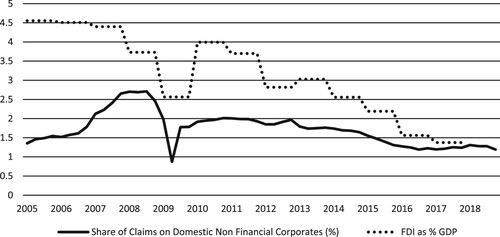
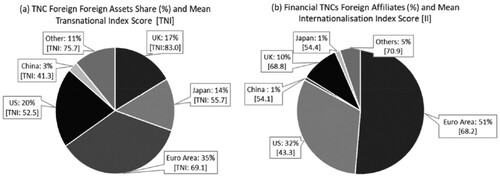
Figure 7. Non-Financial and Financial TNCs International Presence (2017). Notes: The TI Score for Non-Financial TNCs is calculated as the average of foreign assets to total assets, foreign sales to total sales and foreign employment to total employment and is averaged for each country/currency area. Financial TNC affiliates refer to the majority owned foreign affiliates of the top 50 Financial TNCs by foreign assets. The Internationalisation Index (II) score is calculated as the number of foreign affiliates divided by the number of all affiliates and is averaged for each country/currency area. Source: UNCTAD World Investment Report 2018.