Figures & data
Figure 1. 1966 year-end swaps and deposit operations. Source: author’s illustration based on McCauley and Schenk (Citation2020, p. 26).
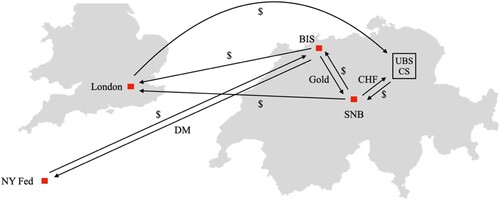
Figure 2. Outstanding swap amounts by counterparty during the global financial crisis and the Covid-19 pandemic, in $ billion. Source: Federal Reserve Bank of New York.
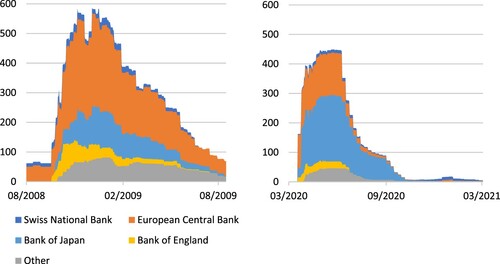
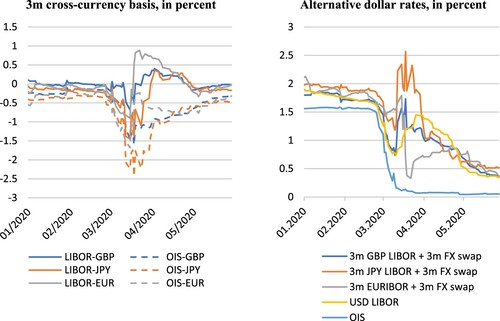
Figure 3. Short-term funding markets under stress. Source: Bloomberg Terminal, author’s calculations.