
Figures & data
Table 1. Estimated job losses in prominent impact assessments
Figure 1. UK employment in financial services post-Brexit referendum. Source: NOMIS official labour market statistics.
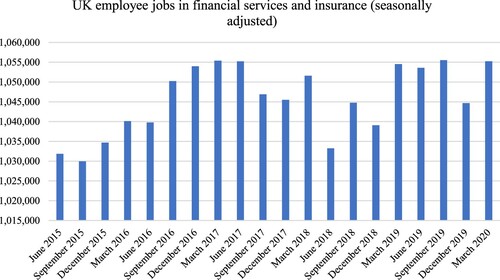
Table 2. Total UK and EU27 FDI projects and % change, 2017-2018
Figure 2. Venture capital investment 2016-2019, including averages, in UK, Germany, France (billions of US dollars). Source: Tech Nation Citation2020.
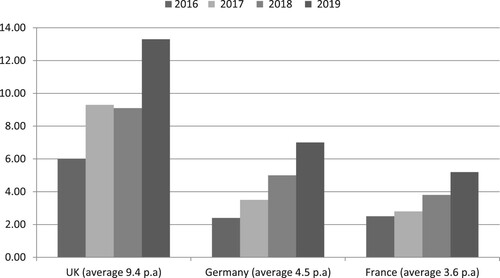
Table 3. Total IRD’s and euro-denominated IRD’s in UK, France, and Germany: 2016 and 2019 (Daily averages, in millions of US dollars)
Table 4. FX total, FX euros, FX dollar swaps: 2016 and 2019 (Daily averages, in millions of US dollars)