
Figures & data
Figure 1. Different aspects of the governance of the environmental state. The distance of states to markets decreases from left to right.
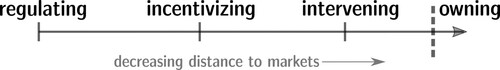
Table 1. Different ideal-typical state carbon capital decarbonisation strategies.
Table 2. Top 10 states as fossil-fuel hosts and owners.
Table 3. Top 10 states as transnational carbon state capital hosts and owners.
Table 4. Share of carbon state capital invested cross-border.
Table 5. Investment profiles of the top 10 states as fossil owners.
Figure 2. Relation between total carbon state ownership (y-axis) and the ration between this ownership and GDP (x-axis). Both axes are logarithmic for representational reasons.
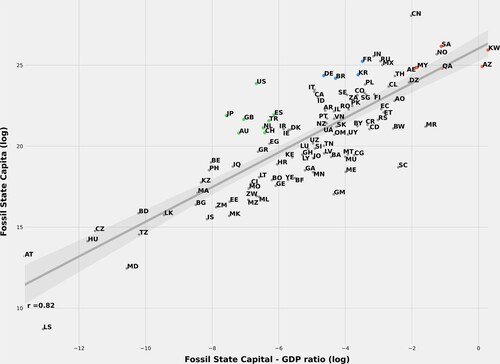
Figure 3. Analytical heuristic for analysing state decarbonisation strategies.
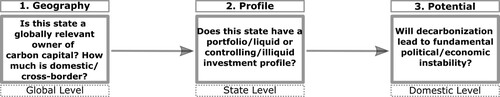
Table 6. Possible interplay of state ownership with other environmental state dimensions.