Figures & data
Figure 1. Macrofinancial Stability Index (MSI) and supercycles, US (1962-2019) and UK (1967-2019).
Note: The figure depicts the 5-year moving average of the MSI. The data sources are reported in Table A1.
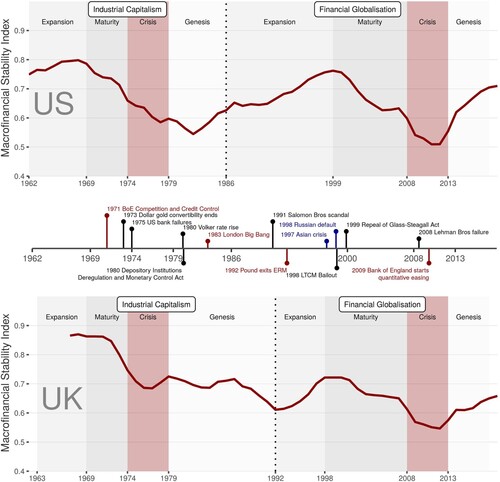
Table 1. Two post-war supercycles.
Table A1. Variables and data sources used for the construction of the Macrofinancial Stability Index (MSI).
Figure A1. Macrofinancial Stability Index (MSI) and supercycles, Canada (1966-2019), France (1973-2019), Italy (1975-2019) and Japan (1975-2019). Note: The figure depicts the 5-year moving average of the MSI. The data sources are reported in Table A1.
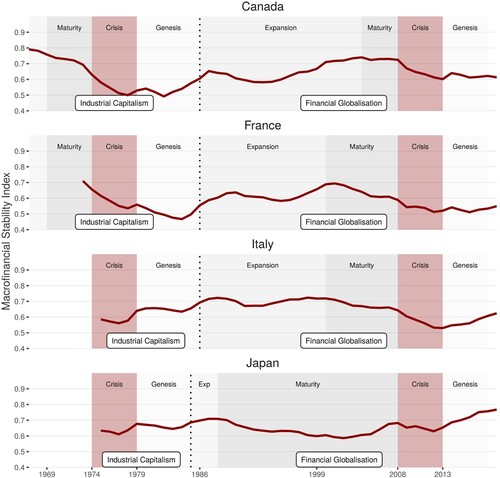
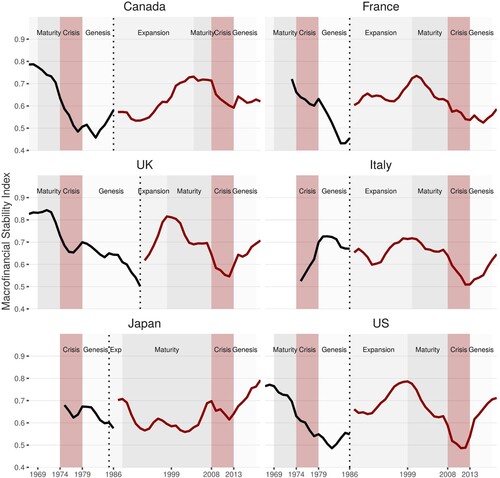
Figure A2. Macrofinancial Stability Index (MSI) and supercycles, G7 countries (except for Germany), various starting years until 2019, supercycle-specific maximum, minimum and median values. Note: The figure depicts the 5-year moving average of the MSI. The data sources are reported in Table A1.