
Figures & data
Figure 1. GDP and Unemployment Rate. Source: Eurostat.
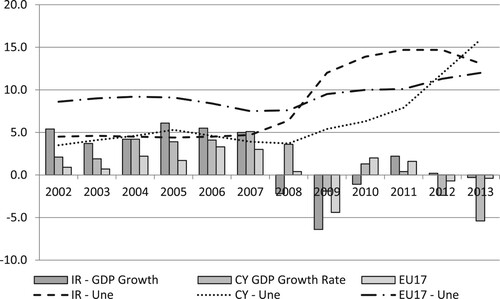
Table 1. Size of banking sector: Total assets of credit institutions as percentage to GDP (2009).
Figure 2. Private Debt, % of GDP. Source: Eurostat.
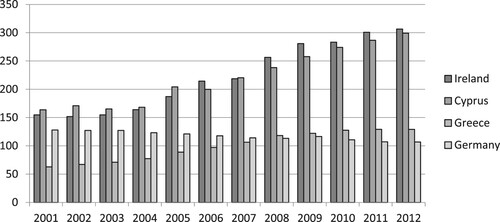
Figure 3. Public Debt and Budget Deficit levels, % of GDP. Source: Eurostat.
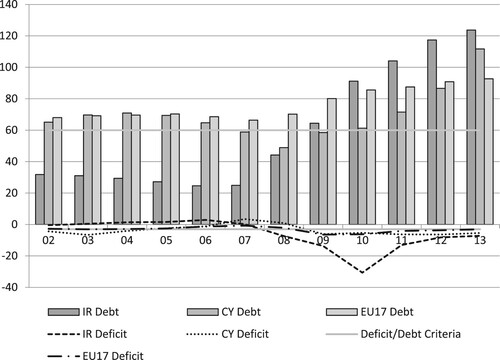
Table 2. From Bailout to Bail In: a timeline of events.
Figure 4. Evolution of Irish Sovereign Bond Yields. Source: Bloomberg.
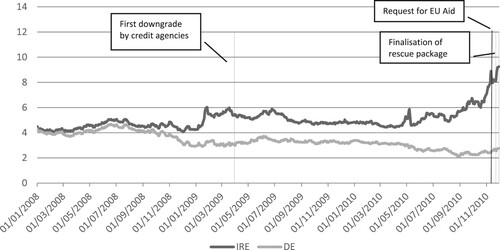
Table 3. Bank non-performing loans to total gross loans (%).
Figure 5. Evolution of Cypriot Sovereign Bond Yields Source: Bloomberg.
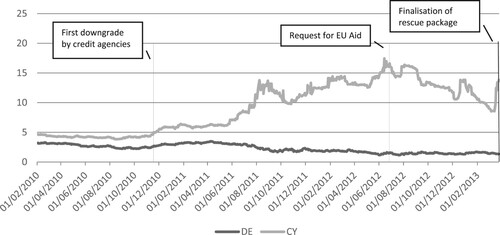
Table 4. Irish and Cypriot Programmes: a snapshot of the key provisions.