Figures & data
Table 1. Variables representing the five institutional forms.
Figure 1. Timeline of the mining regimes.
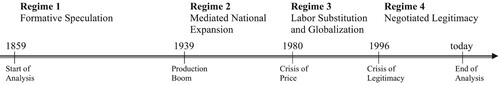
Table 2. Characteristics of the four Canadian mining regimes.
Figure 2. Booms in Gold Production in Canada and Selected Provinces, 1858–1985. Source: Author’s contribution from Natural Resources Canada (Citation2021).
Note: Three gold booms occur during the regime period: (1) in British Columbia, 1858–1862 (Cariboo and Frayser Canyon); (2) Klondike Gold Rush, Yukon, 1896–1899 and (3) Quebec and Northern Ontario, from the 1920s. The quantity shipped uses a proxy, as the quasi-entirety of production was exported and followed the same cycles.
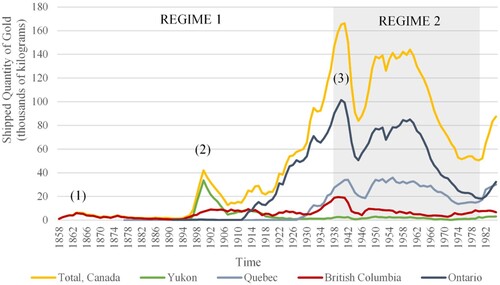
Figure 3. Growth and Composition of Inputs in the Industry of Mining, Canada, 1961–2019. Source: Author’s contribution from Statistics Canada (Citation2024).
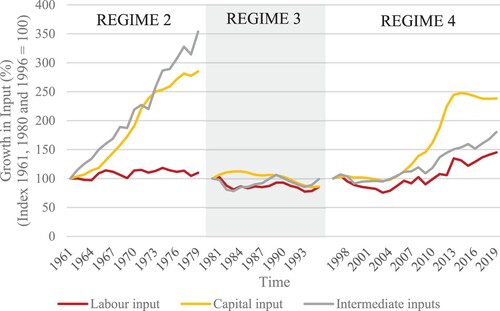
Figure 4. Commodity Price Cycle in Metals and other Minerals, 1960–2010. Source: Macdonald (Citation2017) and Statistics Canada (Citation2011).
Note: The value of production increases while the total employment decreases during the third regime.
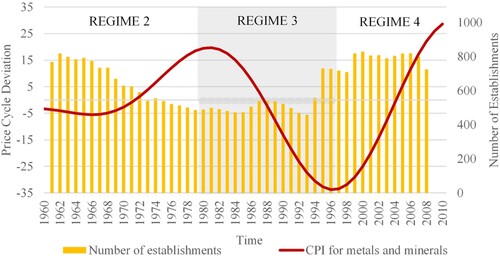
Figure 5. Value of Production and Labour Force of Canadian Mines, 1961–2000. Source: Author’s contribution Statistics Canada (Citation2006).
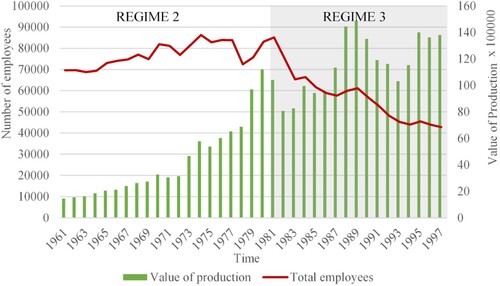
Figure 6. Capital Inflow from the United States in the Sectors of Energy and Mineral, 1972–2022. Source: Author’s contribution from Bank of Canada (Citation2024), Statistics Canada (Citation2023) and U.S. Bureau of Economic Analysis (Citation2024).
Note: BCIP refers to the Annual Bank of Canada commodity price index for Energy and Metals and Minerals, respectively. The flow of direct investment from the United States are larger and increase before in Energy than Minerals.
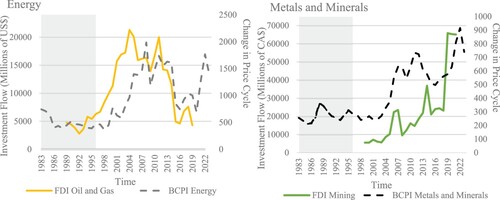
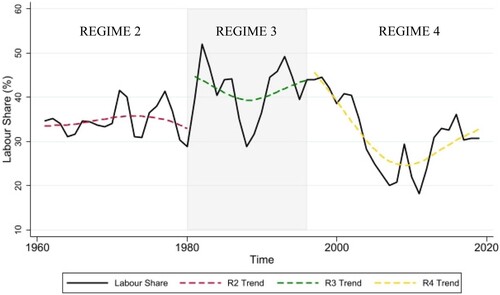
Figure 7. Changes in the Labour Share in the Mining Industry, Canada, 1961–2019. Source: Author’s calculation from Statistics Canada (Citation2024).
Note: Industry based on North American Industry Classification System (NAICS). Trends calculated using Christiano and Fitzgerald (Citation2003) time series.