Figures & data
Figure 1. Per capita GDP in Budapest and the least developed Hungarian county.
Source: CSO Hungary (1994–2014).
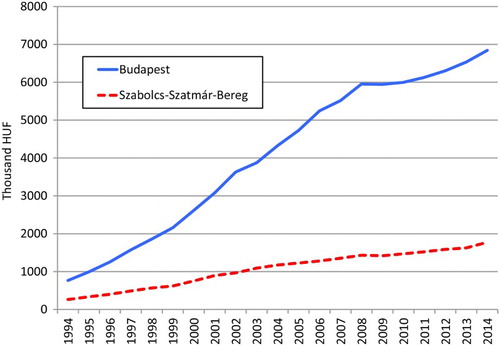
Table 1. Indicators on the relative position of Budapest in the national context.
Figure 2. The structure of the metropolitan region of Budapest.
Source: Dövényi and Kovács (Citation2006).
Figure 3. Development poles in the Budapest Metropolitan Region.
Source: Burdack, Dövényi, and Kovács (Citation2004).
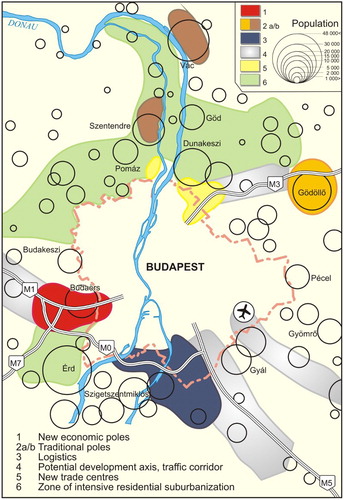
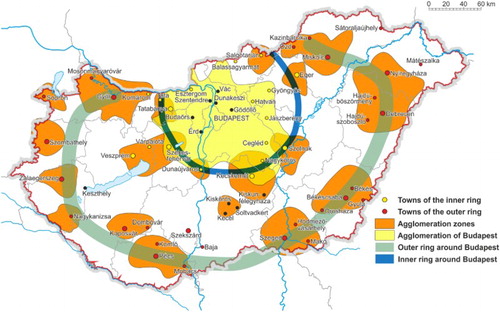
Figure 4. The inner and outer urban rings around Budapest according to official policy documents.
Source: National Development and Teritorial Development Concept (2014).