Figures & data
Table 1. Smart City (SC) development models.
Table 2. Smart City (SC) models, measurement frameworks and indexes.
Figure 1. Overview of UK smart city case studies.
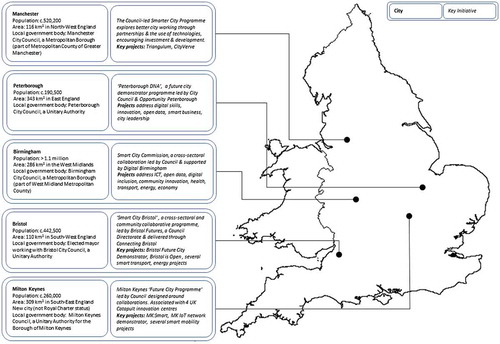
Figure 2. View of Birmingham City Town Hall, one of some 200 city public buildings having free Wi-Fi provided as a means of encouraging citizens to engage with city data feeds and smart city solutions.
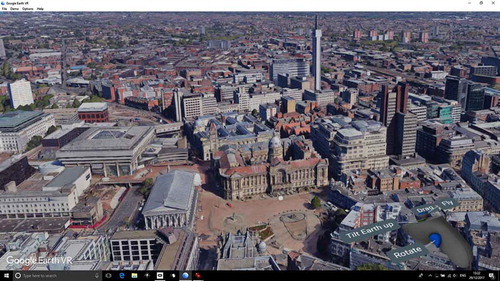
Figure 3. View across Bristol, centred on the ‘We The Curious’ collaborative science museum (previously ‘At-Bristol’) (www.wethecurious.org), with its planetarium and Open Data Dome in the foreground. The Dome can portray a variety of city datascapes aided by local city companies such as Zubr (zubr.co) and enables interactive public participation.
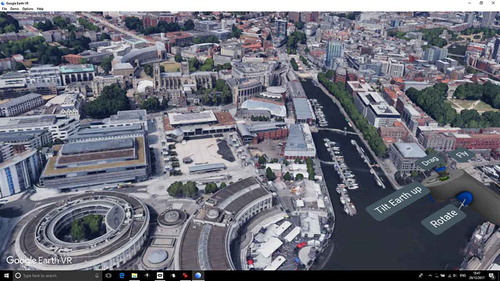
Figure 4. View across Manchester of Oxford Road, a focal point for the Corridor Manchester, Innovation District identified for urban transformation through the Triangulum project.
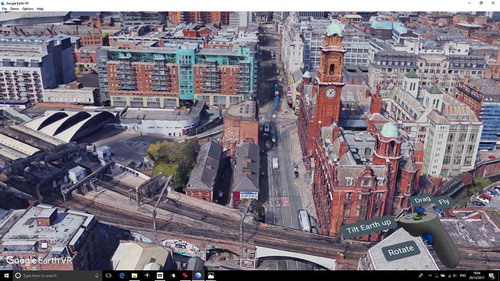
Figure 5. View of Milton Keynes, north-east from the railway station towards the city centre. Plans with LUTZ Pathfinder are to use this route for an autonomous passenger transport service, connecting the station with the business district.
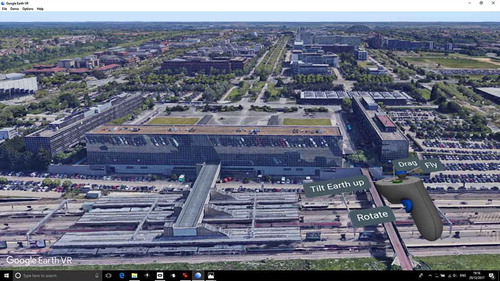
Figure 6. View across Peterborough, past the Cathedral, towards the Smart Fengate Business Cluster (www.futurepeterborough.com/project/smart-fengate), an industrial area of the city, where a sharing economy digital platform is being trialled to provide solutions for greater resource efficiency and reduced waste.
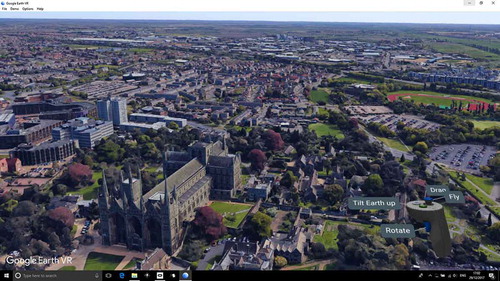
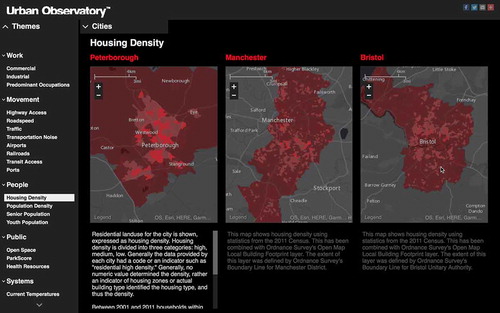
Figure 7. The ESRI Inc. ‘Urban Observatory’ showing city housing density data for Peterborough, Manchester and Bristol (www.urbanobservatory.org).