Figures & data
Figure 1. The ‘Arrogance of space’. Source: Copenhagenize.
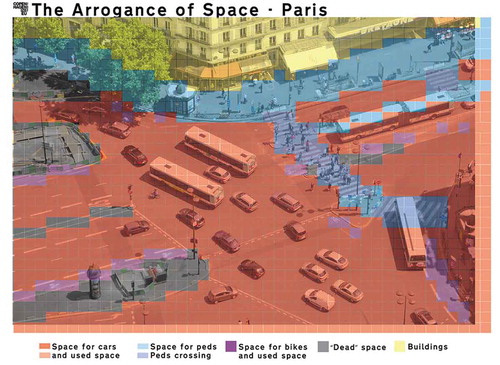
Figure 2. Sample of BGT map in central Amsterdam (right hand corner zoomed in).
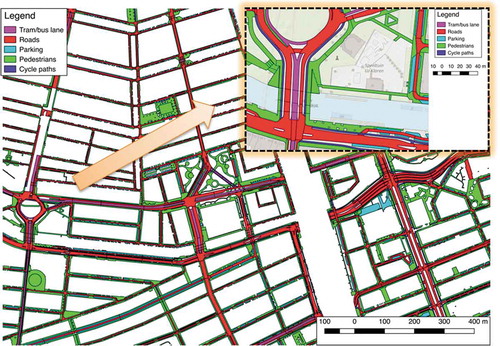
Figure 3. Overall road space distribution in Amsterdam.
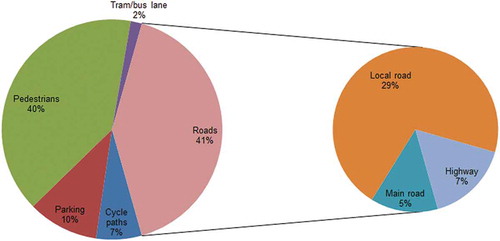
Figure 4. Percentage of road space allocated to motorized traffic (left) and pedestrians (right) by city area.
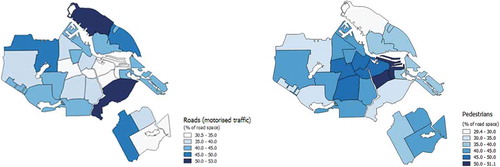
Table 1. Comparison of road space distribution and modal share in Amsterdam.
Table 2. Comparison of road space distribution and total km travelled per mode in Amsterdam.
Figure 5. Relative amount of space occupied by different modes of transport (car space usage is based on 1 occupant at 50 km/h; bicycle space is based on 15 km/h). Source: Municipality of Amsterdam.
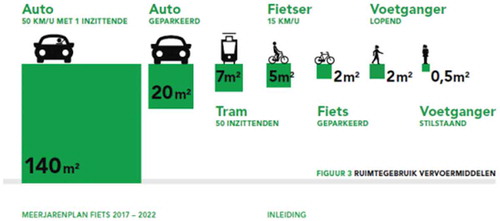
Table 3. Comparison of road space distribution and modal share weighted by space requirement for each mode.
Table 4. Comparison of road space distribution between cities.
Figure 6. Map of average traffic speeds in central Amsterdam. Source: Spotzi.
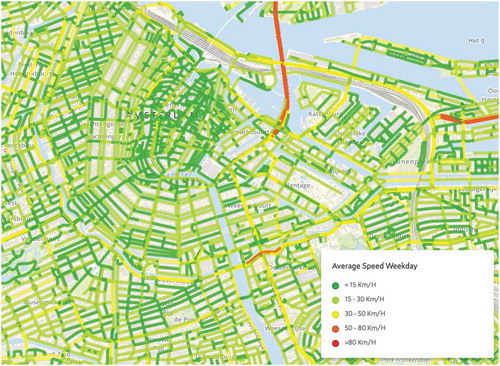
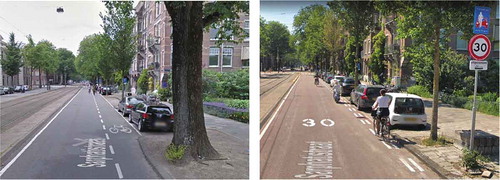
Figure 7. Sarphatistraat before (above) and after (below) its redesign as a ‘bicycle street’. Source: Google Street View.