Figures & data
Figure 1. Location of cities and campuses: (a) Amsterdam, Utrecht, and Groningen; (b) location of inner-city campuses and SPs in each city.
Figure 2. Visualization of public spaces typologies.
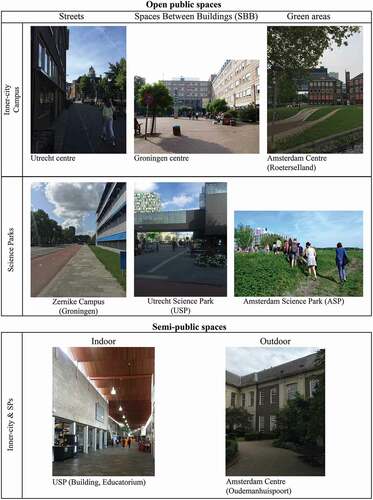
Table 1. Number of VGI responses and frequency of creative encounters per campus
Table 2. Explanatory variables
Table 3. Generalized negative binomial linear model
Table 4. Generalized negative binomial linear models: Comparison between inner-city campuses and SPs
Figure 3. Frequency of responses per 100x100m grid-cell: (a) total dataset; (b) Inner-city; (c) SPs.
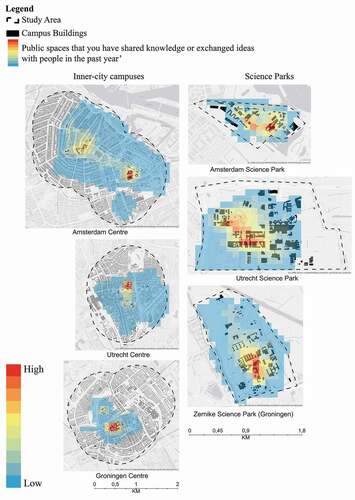
Figure 4. Mapped frequency of creative encounters per campus, aggregated to 100 × 100 grid-cells.