Figures & data
Figure 1. Pictures of the five streets.
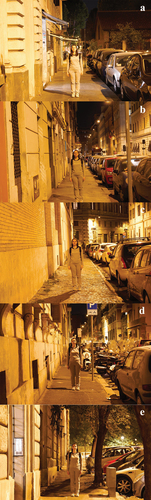
Table 1. Characteristics of the five roads selected for the survey.
Table 2. Reflectance values of the five roads ‘materials.
Table 3. Luminance values measured in the five roads.
Table 4. Illuminance values (lux) measured in the five roads.
Table 5. Questions presented in the questionnaire with relative answers.
Table 6. Variance of the linear correlation (R2) between participants’ ratings to different questions.
Table 7. Variance of the linear correlation (R2) between participants’ ratings and mean luminance levels of analysed areas.
Table 8. Variance of exponential correlation (R2) between participants’ ratings and mean illuminance levels (lux) of the sidewalk.
Figure 2. Question Q1: participants day-night ratings of the five streets respect to the mean luminance levels of Scene, Sidewalk, Wall and Center.
Figure 3. Question Q2: participants day-night ratings of the five streets respect to the mean luminance levels of Face and Background.
Figure 4. Question Q3: participants day-night ratings of the five streets respect to the mean luminance levels of Background.
Figure 5. Question Q4: participants nighttime ratings of the five streets respect to the mean luminance levels of Wall and Face.
Figure 6. Question Q5: participants nighttime ratings of the five streets respect to the mean luminance levels of Face.