
Figures & data
Figure 1. Structural model indicating the predicted relationships between the latent variables.
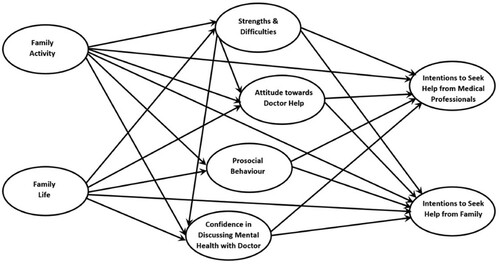
Table 1. Descriptive statistics for the latent variables within the model.
Table 2. Descriptive statistics split by gender for the latent variables within the model.
Table 3. The estimated measurement components of the structural equation model.
Figure 2. Structural model indicating the relationships between the latent variables.
Note: *p < 0.05; **p < 0.01; ***p < 0.001.
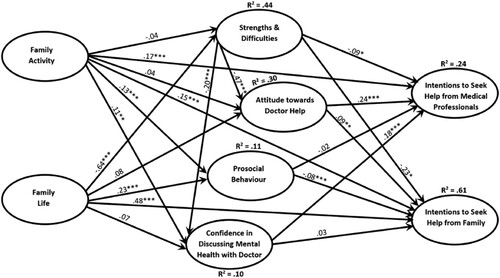
Table 4. Multi-group comparison of SEM model path coefficients, by gender.