
Figures & data
Figure 1. Schematic illustration of a trial on the rhyme decision task. In the example, the word “bite” is presented along with the two images “kite” and “door”. When making the correct judgement, participants would respond with by pressing “S” to indicate that the rhyme was on the left.
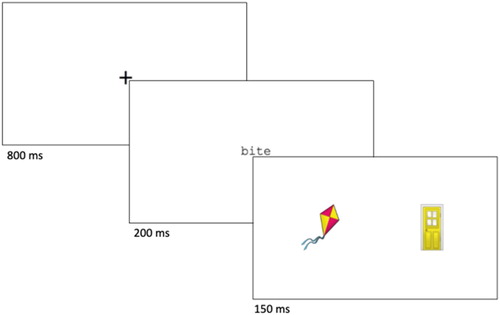
Figure 2. An example stimulus from the chimeric faces task. In the example, “happiness” is shown on the left and “sadness” on the right. A participant who is right lateralized for emotional processing would be more likely to perceive the emotion in the left hemifield and would, therefore, respond “happiness”.
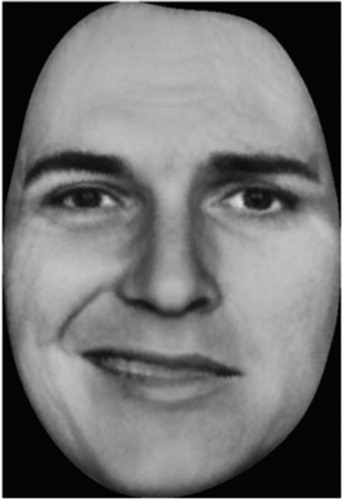
Table 1. Count of left- and right-handers who report left or right on self-reported footedness, and eyedness (Miles test).
Figure 3. Left side (L) vs right side (R) scores for sessions 1 and 2 for the behavioural laterality tasks. The diagonal dotted line shows the point of equality: points above this are higher for R than L, and points below are higher for L than R. Mean values for R and L are shown as horizontal and vertical dotted lines. The colour of the points indicates the participants’ handedness (pink = right-handed; blue = left-handed).
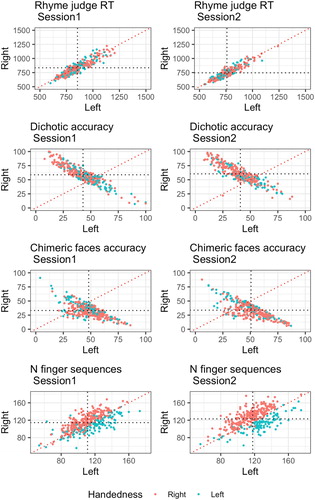
Table 2. Mean LIs and results from one-sample t-tests and Shapiro-Wilks tests for departure from normality for the rhyme decision (RD), dichotic listening (DL), chimeric faces (CF), and finger tapping (FT) tasks at sessions 1 and 2.
Table 3. Mean LI_z and percentage of participants who were significantly left lateralized (z > 1.96) or right lateralized (z < −1.96) on the rhyme decision (RD), dichotic listening (DL), chimeric faces (CF), and finger tapping (FT) tasks at sessions 1 and 2.
Figure 4. Scatter plots for session 1 and session 2 data for LI_z scores on each laterality task: (A) rhyme decision, (B) dichotic listening, (C) chimeric faces, and (D) Finger tapping. Handedness is colour coded with extreme left-handers identified as those who have a score below −90 on the Edinburgh Handedness Inventory. Note that z-scores are censored at absolute values of 5.
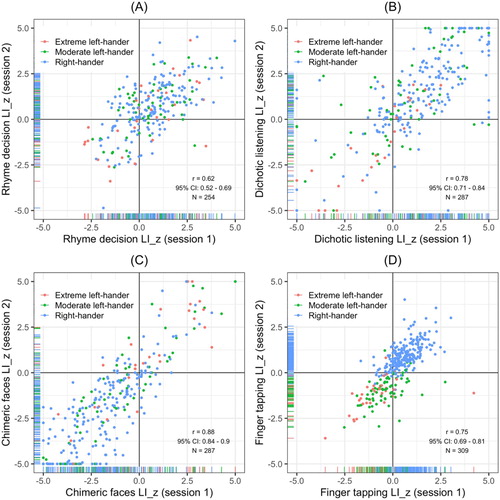
Table 4. Test-retest reliability estimates and 95% CIs for the rhyme decision (RD), dichotic listening (DL), chimeric faces (CF), and finger tapping (FT) tasks.
Figure 5. Test-retest correlations for (A) the dichotic listening task and (B) the chimeric faces task when using a variable number of trials to calculate laterality indices. The red dashed line marks the test-retest correlation r = .65. The correlations coefficients are shown as absolute values.
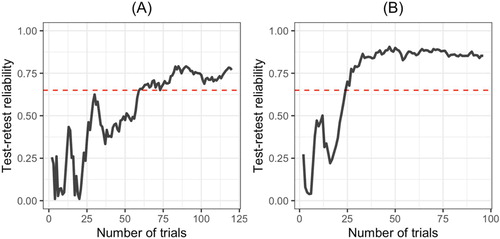
Table 5. Frequencies of laterality typicality for extreme left-handers, moderate left-handers and right-handers across the rhyme decision (RD), dichotic listening (DL), and chimeric faces (CF) tasks.
Table 6. Spearman correlations between the LI_z scores for the different tasks in two Sessions.