
Figures & data
Figure 1. Image used in kissing question.
Note: The figure indicates the labels shown to participants to ask them which cheek of an emotionally close person they would kiss, with left-right labels reflecting the viewer’s perspective.
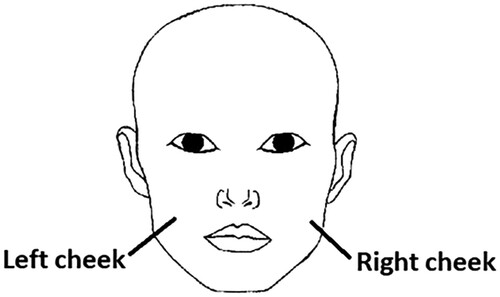
Figure 2. Jittered density plot for Edinburgh Handedness Inventory scores.
Note: To facilitate comparisons across measures, the modified Edinburgh Handedness Inventory (EHI) score was calculated using means across the ten items, expressed here on a scale of −100 (always left) through 0 (both hands equally) to 100 (always right). Data show raw scores as a function of handedness and sex. Bars indicate standard deviations with means represented by dots in their centre.
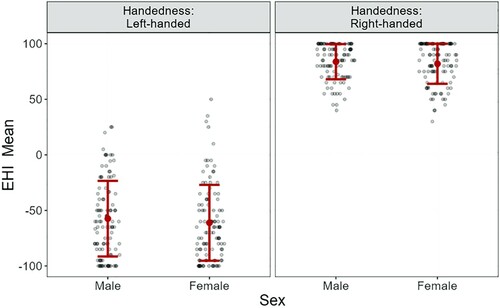
Figure 3. Jittered density plot for footedness.
Note: To facilitate comparisons across measures, footedness was calculated using means across the three items, expressed here on a scale of −100 (always left) through 0 (both feet equally) to 100 (always right). Data show raw scores as a function of handedness and sex. Bars indicate standard deviations with means represented by dots in their centre.
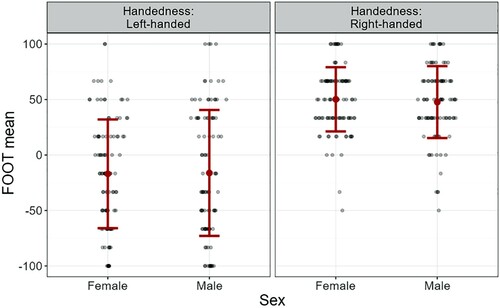
Figure 4. Jittered density plot for eyedness.
Note: To facilitate comparisons across measures, eyedness was calculated using means across the three items, expressed here on a scale of −100 (always left) through 0 (both hands equally) to 100 (always right). Data show raw scores as a function of handedness and sex. Bars indicate standard deviations with means represented by dots in their centre.
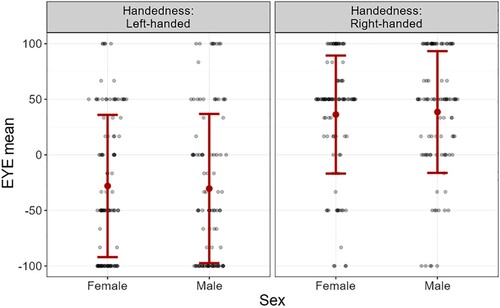
Figure 5. Hand use for masturbation.
Note: Percentage observations as a function of sex and handedness of responses to the three masturbation laterality questions “If you masturbate please indicate which hand you typically use”; “If your hands are not holding anything else, please indicate which hand you typically use to masturbate”, and “If you hold a sex aid to masturbate, such as a vibrator, please indicate which hand you typically use”. Totals do not always add to 100% due to rounding.
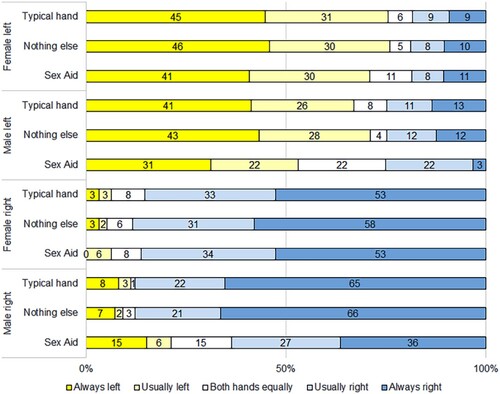
Figure 6. Cheek kissing preference.
Note: Percentage observations of responses to the kissing cheek laterality question, with the left cheek and right cheek being expressed from the perspective of the viewer, as shown in . Totals do not always add to 100% due to rounding.
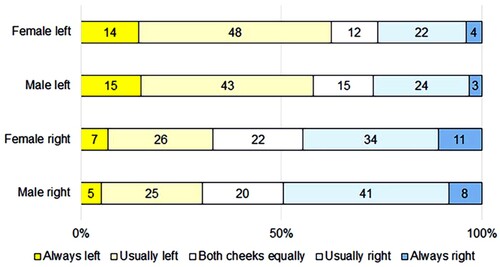
Figure 7. Frequency of masturbation.
Note: Percentage observations of responses to the masturbation frequency question. Abbreviations: / m = per month; / w = per week, 8+ = more than 8 times. Totals do not always add to100% due to rounding.
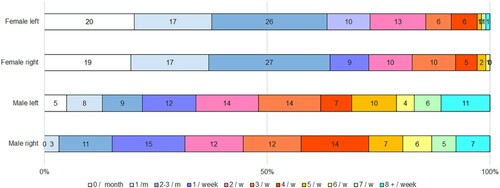
Table 1. Means and SDs per measure per condition.
Table 2. Strength of hand preference.
Table 3. Correlation Matrix for masturbation and other behaviours.
Data availability
Supplemental data for this article can be accessed at: https://doi.org/10.6084/m9.figshare.16912966.v1.