Figures & data
Figure 1. (a) Stimulus lines for a basic endpoint weightings design. Four line configurations (A-D) are created by the factorial crossing of two left endpoint positions (−50, −100 mm) with two right endpoint positions (50, 100 mm), coded relative to the horizontal midline (dotted line). (b) An example bisection response for a line of configuration C, bisected by a mouse-controlled cursor on a monitor. The horizontal coordinates of the two endpoints (L and R) and the response position (P) are all coded relative to the centre of the display. In this example, the line has been bisected accurately (bisection error is zero) but the response position P would be recorded as +25 mm. For illustrative purposes, the hand cursor-icon has been over-scaled, and the alphabetic labels and dotted midline have been added.
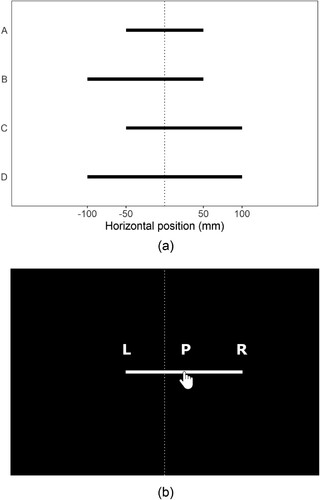
Table 1. Descriptive statistics for measures of landmark task performance for each session, with a one-sample t-test against zero, and a standardized effect size estimate (Cohen’s d) for the measure of perceptual bias, PSE.
Table 2. Number of valid psychometric fits showing correct and reversed patterns of performance according to the landmark task instruction (indicate which is “shorter” or “longer”) and test session.
Figure 2. Scattergrams relating Session 1 and 2 scores for: two measures of bias for the line bisection task, DBE (panel a) and EWB (panel b); and a proposed non-lateralized measure of attention for the line bisection task, EWS (panel c). The Pearson correlation (r) is reported as a measure of test-retest reliability, and the Concordance Correlation Coefficient (CCC) as a measure of test-retest agreement. The dotted line is the line of identity, and the solid line is the line of best fit (±1SE shaded area). Marginal histograms depict the distributions of scores per session.
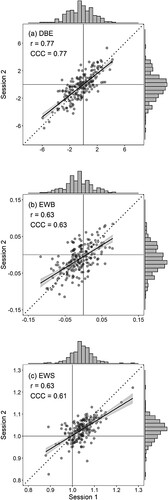
Table 3. Descriptive statistics for measures of line bisection performance, for each test session, with a one-sample t-test against zero, and a standardized effect size estimate (Cohen’s d) for the two measures of bisection bias, DBE and EWB.
Table 4. Correlations [95% CIs] are Pearson’s r between measures of bisection performance for Session 1 (above the diagonal, n = 229) and Session 2 (below the diagonal, n = 224).
Figure 3. (a) Mean EWS by half-block and session. (b) Mean bisection response time by half-block and session. The y-axis is on a logarithmic scale, but the axes ticks and labels are given in seconds, for ease of interpretation. In both plots, error bars show 95% confidence intervals for within-subject effects (Morey, Citation2008).
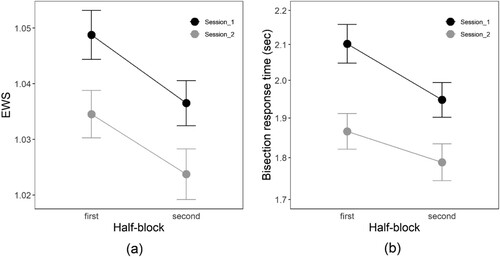
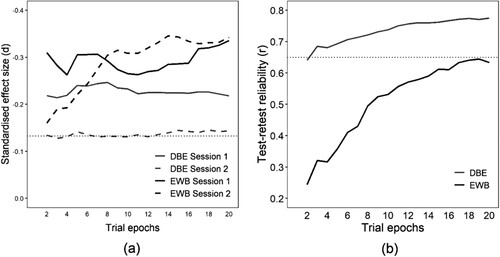
Figure 4. (a) Standardized effect size of pseudoneglect for each session for DBE and EWB, as a function of the number of trial epochs from which they are estimated. The dotted horizontal line represents the critical effect size for significance at the conventional level (p < .05), assuming a sample size of 222 (the lowest number of participants with valid bisection data for any of these analyses). (b) Test-retest reliability (r) of DBE and EWB as a function of the number of epochs from which they are estimated. The dotted horizontal line is at .65, a nominal threshold for practically useful reliability (Parker et al., Citation2021).