
Figures & data
Figure 1. Examples of the Pictures of Facial Affect chimeras, used in previous research (e.g., Workman et al., Citation2006). From left to right faces represent anger, sadness, fear, disgust, happiness and surprise.
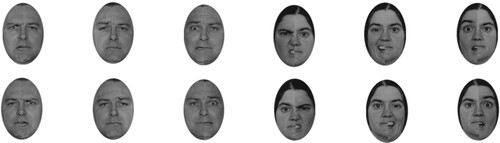
Figure 2. Examples of the NimStim chimeras created. From left to right faces represent anger, sadness, fear, disgust, happiness and surprise.
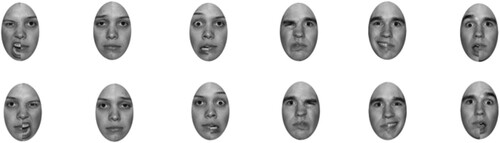
Table 1. Model selection for emotion for the development of the NimStim CFT.
Figure 3. Histogram depicting percentage of participants and their corresponding overall laterality quotient for the Pictures of Facial Affect Chimeric Face Test. Dotted line indicates a score of 0 (no bias).
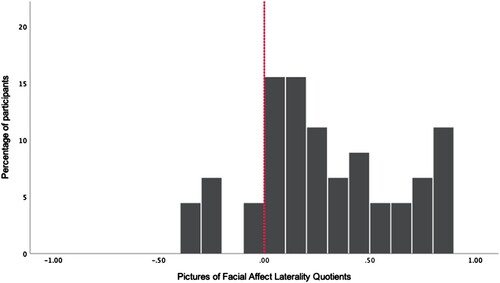
Figure 4. Histogram depicting percentage of participants and their corresponding overall laterality quotient for the NimStim Chimeric Face Test. Dotted line indicates a score of 0 (no bias).
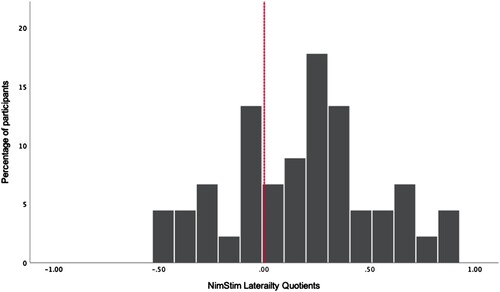
Table 2. Mean laterality quotients (range −1 to +1) for each emotion block for the Pictures of Facial Affect and the NimStim CFT. T-tests show significant differences between the two tasks.
Table 3. Inter-correlations between pictures of facial affect CFT stimulus emotions.
Table 4. Inter-correlations between NimStim CFT stimulus emotions.
Table 5. Correlations for each emotion laterality quotient across tasks.
Data availability statement
The participants of this study did not give written consent for their data to be shared publicly.