587
Views
2
CrossRef citations to date
0
Altmetric
Research Article

From particles of liquid-crystalline dispersions to rigid deoxyribonucleic acid nanoconstructions

Pages 2-19 | Received 31 Oct 2009, Accepted 14 Dec 2009, Published online: 28 Jan 2011

Figures & data

Figure 1. The formation of a particle of ds NA CLCD. Polymer molecules are shown by filled red circles (1) and the DNA CLCD particle is encircled by an oval (2); π means osmotic pressure of the solution (red arrows); ordering DNA molecules in one quasinematic layer is illustrated (2). ds DNA molecules (1) in subsequent layers (2) are located at distance d, which depends on the osmotic pressure of the solution. The formation of CLCD particles is characterised by spatially twisted packing of neighbouring layers of DNA (or RNA) molecules and is accompanied by the appearance of an abnormal negative band in the circular dichroism (CD) spectrum in the case of DNA and abnormal positive band in the case of RNA, located in the absorption region of nitrogen bases (3).
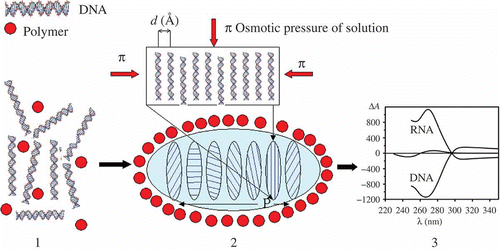
Figure 1. The formation of a particle of ds NA CLCD. Polymer molecules are shown by filled red circles (1) and the DNA CLCD particle is encircled by an oval (2); π means osmotic pressure of the solution (red arrows); ordering DNA molecules in one quasinematic layer is illustrated (2). ds DNA molecules (1) in subsequent layers (2) are located at distance d, which depends on the osmotic pressure of the solution. The formation of CLCD particles is characterised by spatially twisted packing of neighbouring layers of DNA (or RNA) molecules and is accompanied by the appearance of an abnormal negative band in the circular dichroism (CD) spectrum in the case of DNA and abnormal positive band in the case of RNA, located in the absorption region of nitrogen bases (3).

Figure 2. The scheme of ordering ds DNA molecules in a quasinematic layer. π-osmotic pressure of the solution is shown by red arrows. Due to the ‘liquid’ character of ds DNA packing, various chemical substances or BACs (shown by yellow, green and blue arrows) can quickly diffuse into this layer. The sign X means that the neighbouring layers of ds DNA molecules are twisted in the structure of the CLCD particle.
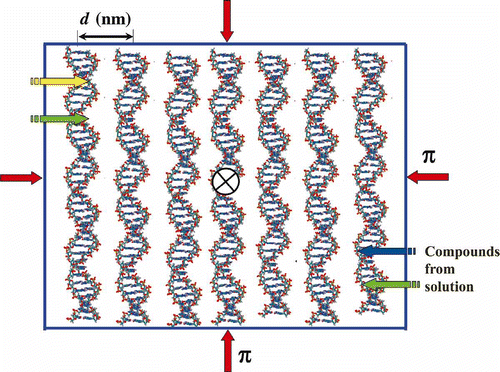
Figure 2. The scheme of ordering ds DNA molecules in a quasinematic layer. π-osmotic pressure of the solution is shown by red arrows. Due to the ‘liquid’ character of ds DNA packing, various chemical substances or BACs (shown by yellow, green and blue arrows) can quickly diffuse into this layer. The sign X means that the neighbouring layers of ds DNA molecules are twisted in the structure of the CLCD particle.

Figure 3. The ‘fluorescence images’ of particles of the DNA CLCD treated with the fluorescent intercalator – SYBR Green. The images were obtained by the confocal microscope Leica TCS SP5; bar – 4 μm; С SYBR Green = 4.9 × 10−6 М; С DNA = 50 μg ml−1; 10 min; С PEG = 170 mg ml−1; 0.3 M NaCl; 0.002 М Na-phosphate solution; pH 6.8.
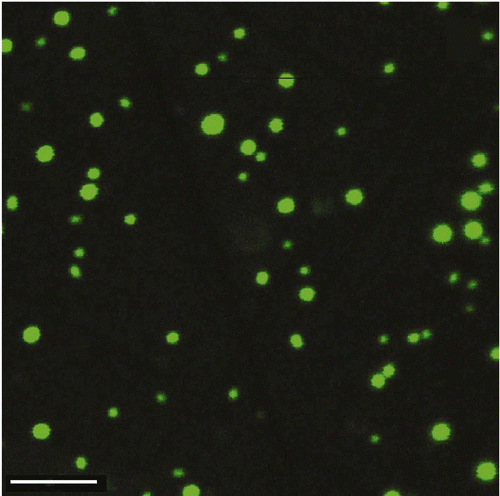
Figure 3. The ‘fluorescence images’ of particles of the DNA CLCD treated with the fluorescent intercalator – SYBR Green. The images were obtained by the confocal microscope Leica TCS SP5; bar – 4 μm; С SYBR Green = 4.9 × 10−6 М; С DNA = 50 μg ml−1; 10 min; С PEG = 170 mg ml−1; 0.3 M NaCl; 0.002 М Na-phosphate solution; pH 6.8.

Figure 4. Two possibilities for spatial fixation of ds DNA molecules in a quasinematic layer. π-osmotic pressure of the solution is shown by red arrows. (a) Neighbouring ds DNA molecules can be chemically linked by ‘nanobridges’ composed of ‘guest’ molecules (red dots) without altering the spatial location of the DNA molecules. (b) Modification of the secondary structure of ds DNA molecules induced by interaction with agent ‘X’ (shown in green) is accompanied by modification of the ds DNA secondary structure and by the increase in interaction of fragments of neighbouring molecules and their spatial fixation. In this case the irregular location of the DNA fragments appears. In both cases, the fixation of the ds DNA molecules or DNA fragments results in formation of ‘rigid’ structures, capable of existing in the absence of the solvent osmotic pressure.
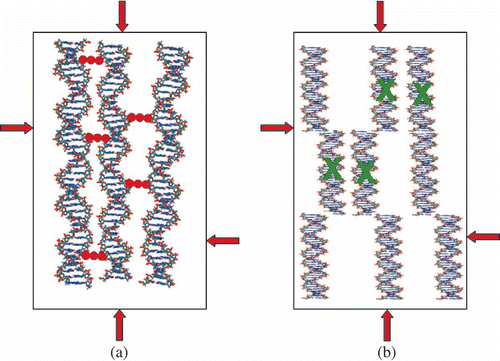
Figure 4. Two possibilities for spatial fixation of ds DNA molecules in a quasinematic layer. π-osmotic pressure of the solution is shown by red arrows. (a) Neighbouring ds DNA molecules can be chemically linked by ‘nanobridges’ composed of ‘guest’ molecules (red dots) without altering the spatial location of the DNA molecules. (b) Modification of the secondary structure of ds DNA molecules induced by interaction with agent ‘X’ (shown in green) is accompanied by modification of the ds DNA secondary structure and by the increase in interaction of fragments of neighbouring molecules and their spatial fixation. In this case the irregular location of the DNA fragments appears. In both cases, the fixation of the ds DNA molecules or DNA fragments results in formation of ‘rigid’ structures, capable of existing in the absence of the solvent osmotic pressure.

Figure 5. Examples of chelate complexes formed between anthraquinone (a) or anthracycline (b) molecules and Cu2+ ions possessing planar structures.
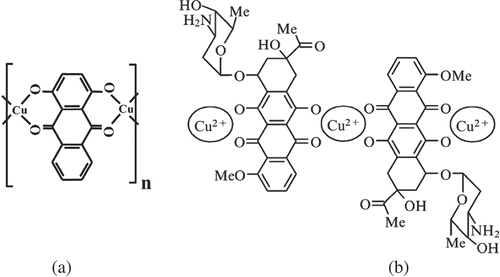
Figure 5. Examples of chelate complexes formed between anthraquinone (a) or anthracycline (b) molecules and Cu2+ ions possessing planar structures.

Figure 6. The structure of nanobridges between two adjacent ds DNA molecules fixed in the spatial structure of a CLCD particle. (a)Top-view projection of the nanobridge between ds DNA (I) and ds DNA (II) along the long axes of these molecules. (b) Nanobridges between DNA molecules (for clarity, the nanobridges are turned on 90° in respect to their real position). Note that in order to realise the formation of nanobridges between suitable reactive groups located in the DNA grooves on the surfaces of neighbouring molecules, it is necessary to rotate one molecule by 180° about the vertical axis.
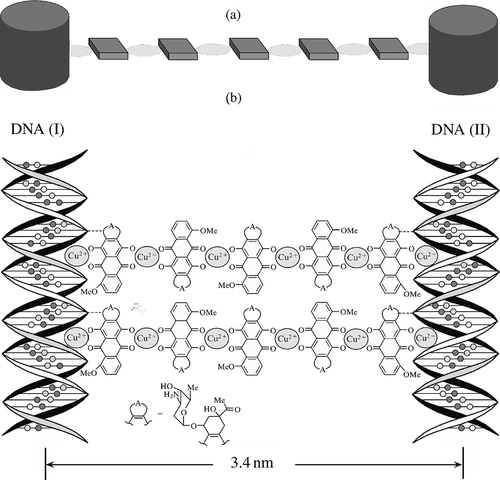
Figure 6. The structure of nanobridges between two adjacent ds DNA molecules fixed in the spatial structure of a CLCD particle. (a)Top-view projection of the nanobridge between ds DNA (I) and ds DNA (II) along the long axes of these molecules. (b) Nanobridges between DNA molecules (for clarity, the nanobridges are turned on 90° in respect to their real position). Note that in order to realise the formation of nanobridges between suitable reactive groups located in the DNA grooves on the surfaces of neighbouring molecules, it is necessary to rotate one molecule by 180° about the vertical axis.

Figure 7. The transition of a ‘liquid’ structure of a DNA CLCD particle into a ‘rigid’ state. π-osmotic pressure of the solution in (a) is shown by red arrows. The ds DNA molecules in the neighbouring layers are shown as rods (a), and each layer is turned by a certain angle relative to the previous layer. The CLCD particle in which ds DNA molecules are ordered exists only under certain osmotic pressure of the solution. The nanobridges in (b) are shown by red double-headed arrows between adjacent ds DNA molecules. Note that the formation of nanobridges does not distort the total spatial structure of the CLCD particle, but this particle can exist under conditions of absence of the osmotic pressure of the solvent.
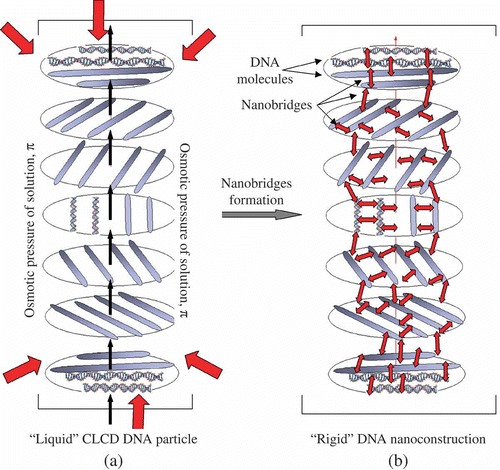
Figure 7. The transition of a ‘liquid’ structure of a DNA CLCD particle into a ‘rigid’ state. π-osmotic pressure of the solution in (a) is shown by red arrows. The ds DNA molecules in the neighbouring layers are shown as rods (a), and each layer is turned by a certain angle relative to the previous layer. The CLCD particle in which ds DNA molecules are ordered exists only under certain osmotic pressure of the solution. The nanobridges in (b) are shown by red double-headed arrows between adjacent ds DNA molecules. Note that the formation of nanobridges does not distort the total spatial structure of the CLCD particle, but this particle can exist under conditions of absence of the osmotic pressure of the solvent.

Figure 8. The AFM images of NaCs formed by ds DNA CLCD particles cross-linked by nanobridges and immobilised onto the surface of the nuclear membrane filter (two-dimensional and 3D images, (a) and (b), respectively); the dark spots are ‘pores’ in the filter, polyethylene terephthalate (PETP); (c) size distribution of the DNA NaCs in two sets of experiments. The images were taken by Smart SPM produced by AIST-NT (Zelenorgad, Russia).
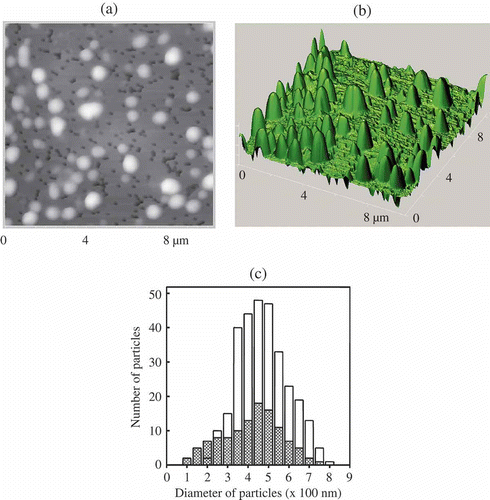
Figure 8. The AFM images of NaCs formed by ds DNA CLCD particles cross-linked by nanobridges and immobilised onto the surface of the nuclear membrane filter (two-dimensional and 3D images, (a) and (b), respectively); the dark spots are ‘pores’ in the filter, polyethylene terephthalate (PETP); (c) size distribution of the DNA NaCs in two sets of experiments. The images were taken by Smart SPM produced by AIST-NT (Zelenorgad, Russia).

Figure 9. The AFM images of initial DNA NaCs (a) and these NaCs split with the help of a microscopic cantilever (b). For conditions see .
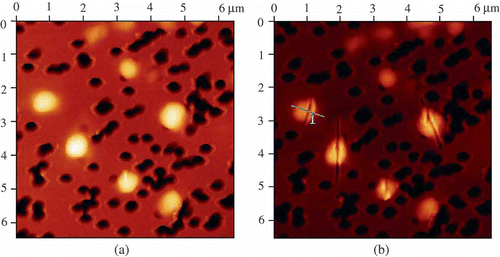
Figure 9. The AFM images of initial DNA NaCs (a) and these NaCs split with the help of a microscopic cantilever (b). For conditions see Figure 8.

Figure 10. The spatial images of the split rigid DNA NaCs. For conditions see .

Figure 10. The spatial images of the split rigid DNA NaCs. For conditions see Figure 8.

Figure 11. The transition from ‘liquid’ to ‘rigid’ structure of the particle of the CLCD induced by gadolinium cations. The osmotic pressure of the solution in (a) is shown by red arrows. One can see (structure in (b)), that here the interaction of ds DNA molecules with Gd-cations results in the practical absence of the regular spatial ordering of neighbouring ds DNA molecules in quasinematic layers. A low solubility of [DNA-Gd] complexes is accompanied by a decrease in the solubility of the whole structure. This ‘rigid’ structure can exist in the absence of the osmotic pressure of a solvent.

Figure 11. The transition from ‘liquid’ to ‘rigid’ structure of the particle of the CLCD induced by gadolinium cations. The osmotic pressure of the solution in (a) is shown by red arrows. One can see (structure in (b)), that here the interaction of ds DNA molecules with Gd-cations results in the practical absence of the regular spatial ordering of neighbouring ds DNA molecules in quasinematic layers. A low solubility of [DNA-Gd] complexes is accompanied by a decrease in the solubility of the whole structure. This ‘rigid’ structure can exist in the absence of the osmotic pressure of a solvent.

Figure 12. AFM images of the particles of CLCD formed by (DNA-Gd3+) complexes and immobilised onto the surface of the nuclear membrane filter. CDNA= 1.07 μg ml−1; CNaCl = 0.03 M; CPEG =17 mg ml−1; CGdCl3 = 0.23 mM; the dark spots are ‘pores’ in the nuclear membrane filter; two sites on the PETP filter are shown.
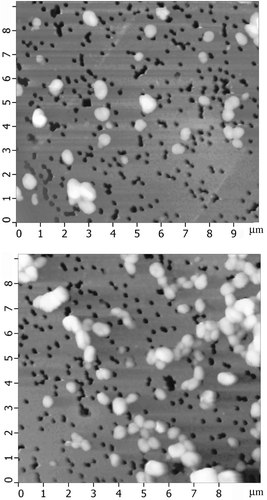
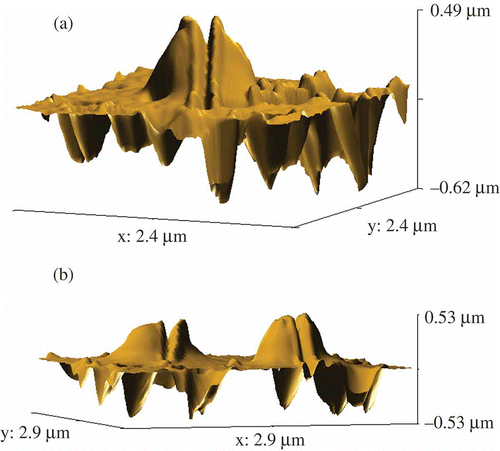
Figure 12. AFM images of the particles of CLCD formed by (DNA-Gd3+) complexes and immobilised onto the surface of the nuclear membrane filter. CDNA= 1.07 μg ml−1; CNaCl = 0.03 M; CPEG =17 mg ml−1; CGdCl3 = 0.23 mM; the dark spots are ‘pores’ in the nuclear membrane filter; two sites on the PETP filter are shown.
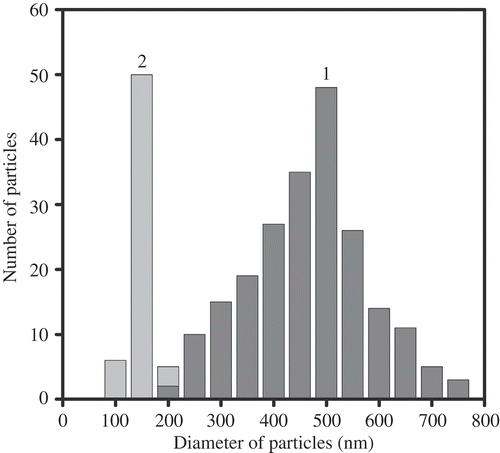
Figure 13. Size distribution of the ds DNA NaCs formed by (DNA-Gd3+) complexes (1) and the pores (2) in the membrane filter. For conditions see .

Figure 13. Size distribution of the ds DNA NaCs formed by (DNA-Gd3+) complexes (1) and the pores (2) in the membrane filter. For conditions see Figure 12.

Reprints and Corporate Permissions

Please note: Selecting permissions does not provide access to the full text of the article, please see our help page How do I view content?

To request a reprint or corporate permissions for this article, please click on the relevant link below:

Academic Permissions

Please note: Selecting permissions does not provide access to the full text of the article, please see our help page How do I view content?

Obtain permissions instantly via Rightslink by clicking on the button below:

If you are unable to obtain permissions via Rightslink, please complete and submit this Permissions form. For more information, please visit our Permissions help page.