
Figures & data
Figure 1. (a) Nematic (N) and (b) smectic-A liquid crystalline phase made from achiral rod-like molecules. (c) Cholesteric phase (N*) made of chiral rod-like molecules. and
represents the nematic director, i.e. a local average orientation of the long molecular axes,
is the pitch of the twisted helix and
is the smectic layer thickness.
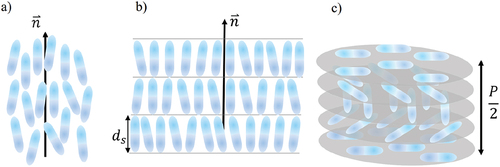
Figure 2. (a) in the twist-bend nematic phase, the far ends of the bent molecules rotate on a cone with a heliconical pitch and
is the tilt angle. This is the simplified figure, there are no layers. (b) Three-dimensional undulation of a pseudo-layer of thickness
in a thin planar cell of thickness
(c) results in a striped pattern that acts as a diffraction grating with period
. The yellow lines in (b) represent the local direction perpendicular to the layer (the local direction of the heliconical axis) and thus the local direction of the optical axis. The length of the measurement line in (c) represents the length of
. Reproduced from Ref. [Citation6] with permission from John Wiley & Sons.
![Figure 2. (a) in the twist-bend nematic phase, the far ends of the bent molecules rotate on a cone with a heliconical pitch d and θ is the tilt angle. This is the simplified figure, there are no layers. (b) Three-dimensional undulation of a pseudo-layer of thickness d in a thin planar cell of thickness L (c) results in a striped pattern that acts as a diffraction grating with period d. The yellow lines in (b) represent the local direction perpendicular to the layer (the local direction of the heliconical axis) and thus the local direction of the optical axis. The length of the measurement line in (c) represents the length of 10\mum. Reproduced from Ref. [Citation6] with permission from John Wiley & Sons.](/cms/asset/a79402d3-0702-42da-b715-4574ca79bd2f/tlcy_a_2168968_f0002_c.jpg)
Figure 3. Molecular structure of the two studied materials and their phase transition temperatures in .
Figure 4. (a) General polarisation properties of first-order diffraction beams: vertically linearly polarised (VLP) incident light has the plane of polarisation rotated by 90 degrees and is horizontally linearly polarised (HLP) after the transition; right circularly polarised light is transformed into left circularly polarised, while diagonally polarised light does not change the plane of polarisation. (b) For VLP and HLP incident light, the plane of polarisation does not change in second-order diffraction beams.
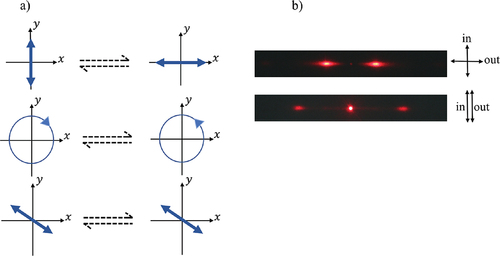
Figure 5. Temperature dependence of the polarisation of the second-order diffraction beams (red: , blue:
) in the case of left circularly polarised incident light for CB7CB in a cell with thickness (a)
and (b) CB6OCB in
. The polarisation is represented on the Poincaré sphere, where the Stokes parameters are normalised,
and
related to the inclination of the long axis of the ellipse (
) and ellipticity
. Black arrows show the direction of temperature increase. (a) Adapted from Ref. [Citation6] with permission from John Wiley & Sons.
![Figure 5. Temperature dependence of the polarisation of the second-order diffraction beams (red: +2q0, blue: −2q0) in the case of left circularly polarised incident light for CB7CB in a cell with thickness (a) 1.6μm \mum and (b) CB6OCB in 1.5μm \mum. The polarisation is represented on the Poincaré sphere, where the Stokes parameters are normalised, S1=cos2Ψcos2e, S2=sin2Ψcos2eand S3=sin2e related to the inclination of the long axis of the ellipse (Ψ) and ellipticity e. Black arrows show the direction of temperature increase. (a) Adapted from Ref. [Citation6] with permission from John Wiley & Sons.](/cms/asset/13db1880-c78b-497e-b236-4b3672b29f7d/tlcy_a_2168968_f0005_c.jpg)
Figure 6. (a) Spatial variation of the optic axis represented by blue arrows of a model (EquationEquation (1)(1)
(1) ) with the modulation period
. Adopted from Ref. [Citation6] with permission from John Wiley & Sons. (b) Spatial dependence of
(blue) and
(red) with a shift
.
![Figure 6. (a) Spatial variation of the optic axis represented by blue arrows of a model (EquationEquation (1)(1) β=β0cos2πDx+s,(1) ) with the modulation period D. Adopted from Ref. [Citation6] with permission from John Wiley & Sons. (b) Spatial dependence of α (blue) and β (red) with a shift s=0.1D.](/cms/asset/27a2527e-828f-442a-9337-7d15f4a1c26a/tlcy_a_2168968_f0006_c.jpg)
Figure 7. a) a layer that was perpendicular to the surface at the time of its formation and at , displaced by
;
is normal to the smectic layer. b) by undulating the layer, its thickness decreases from
to
. c) Two-dimensional undulation of the pseudo-layer with a period
in the direction of the axis
. Reproduced from [Citation34] with permission from the American physical society.
![Figure 7. a) a layer that was perpendicular to the surface at the time of its formation and at y0, displaced by ux,z; v⇀ is normal to the smectic layer. b) by undulating the layer, its thickness decreases from d to d0T. c) Two-dimensional undulation of the pseudo-layer with a period din the direction of the axis x. Reproduced from [Citation34] with permission from the American physical society.](/cms/asset/a409e631-e5ad-49bb-a573-44cd234b4626/tlcy_a_2168968_f0007_c.jpg)
Figure 8. The molecules lie with their long axis (yellow) in the plane of the surface, so the axis of the helix (blue arrow) is at some angle to the surface and the layers are no longer perpendicular to the surface.
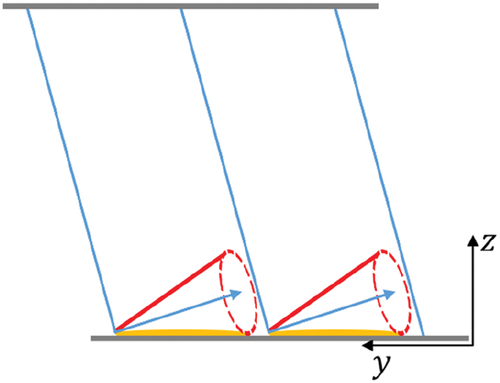
Table 1. Numerically calculated values at which the modulated structure becomes stable and the modulation periods
at the formation of the modulated structure at different values of the compressibility modulus
and different pre-tilts of the layers
in the case of very strong and very weak anchoring. Parameter values:
.
Table 2. Theoretically calculated temperature dependence of the polarisation state (azimuth angle and ellipticity
) of the second-order diffraction peaks (
(red dots) and
(blue dots)) for the LCP incident light for CB7CB
, and CB6OCB
, in the case of a very weak and very strong anchoring.
Figure 9. (a) Period of modulation, and (b) modulation amplitude,
, depending on the ratio
for the case with no pre-tilt of pseudo layers. Red curves: strong anchoring; blue curves: weak anchoring. Parameter values:
,
. Inset in (a) shows the magnified part of
.
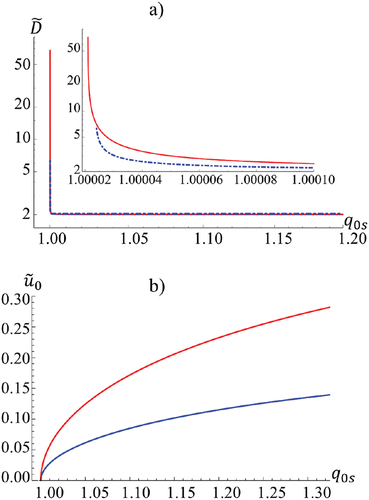
Figure 10. Amplitude of modulation at different values of pre-tilt of pseudo-layers
in the case of (a) very strong and (c) very weak anchoring. The modulation period
is practically the same for (b) very strong and (d) very weak anchoring; blue curves:
, green curves:
and red curves:
. Parameter values:
,
.
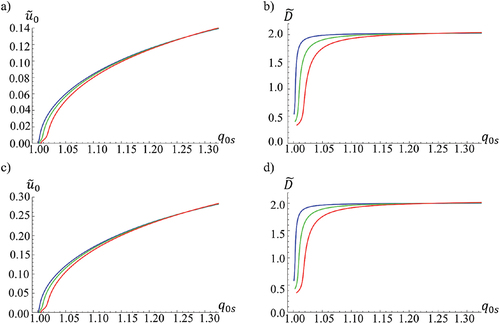
Figure 11. The values of (black circles) and
(red circles) used in numerical calculations of the temperature dependence of the polarisation state of the (± 2q0) diffracted beams (LCP incident beam) for a) CB7CB (
), b) CB6OCB (
) thick cells.
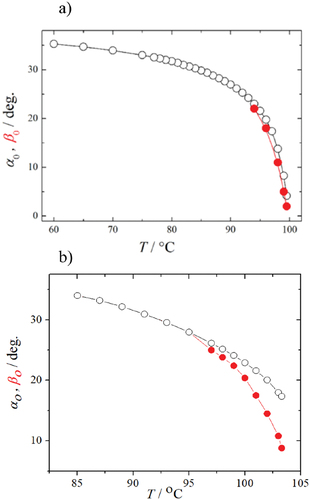
Figure 12. Experimentally measured and theoretically calculated relationships between the intensities of the central peak and the first
and second
diffraction peaks. (a) and (b) CB7CB, (c) and (d) CB6OCB. Black squares: experimental measurements. Very strong anchoring (orange circles: beam propagation method), (blue diamonds: transfer matrix method). Very weak anchoring (red circles: beam propagation method), (green diamonds: transfer matrix method). Adopted from [Citation34] with permission from the American Physical Society.
![Figure 12. Experimentally measured and theoretically calculated relationships between the intensities of the central peak I0 and the first I1and second I2 diffraction peaks. (a) and (b) CB7CB, (c) and (d) CB6OCB. Black squares: experimental measurements. Very strong anchoring (orange circles: beam propagation method), (blue diamonds: transfer matrix method). Very weak anchoring (red circles: beam propagation method), (green diamonds: transfer matrix method). Adopted from [Citation34] with permission from the American Physical Society.](/cms/asset/9b0ad79a-769f-49c7-b42f-d0cd357ae2f1/tlcy_a_2168968_f0012_c.jpg)