
Figures & data
Figure 1. Metal and composite six-frame (half-model shown) for drop test simulation.
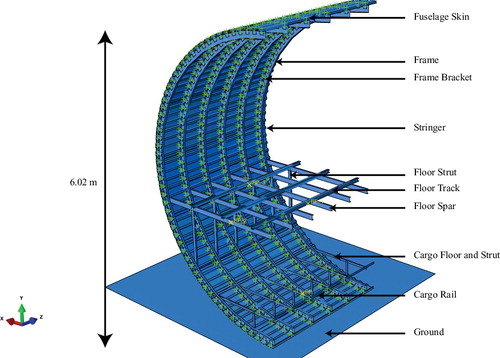
Table 1. Primary structural materials in aircraft models [Citation13,Citation18,Citation20].
Table 2. Primary structural materials in a mid-range civil transport [Citation1,Citation2,Citation13,Citation18,Citation20].
Figure 2. Two-frame experiment before and after impact on a rigid ground.
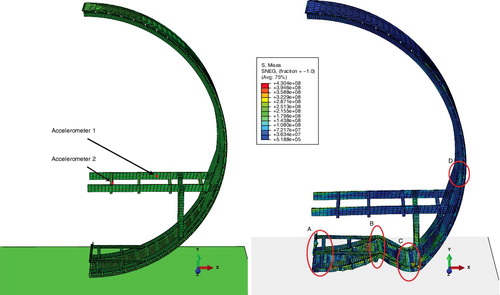
Figure 3. Two-frame experimental collapse test [Citation14].
![Figure 3. Two-frame experimental collapse test [Citation14].](/cms/asset/d852c407-c27a-4f47-b6cf-f23760b9d39a/tcrs_a_1273987_f0003_b.gif)
Figure 4. Six-frame model and accelerometer locations on the seat track and floor spar.
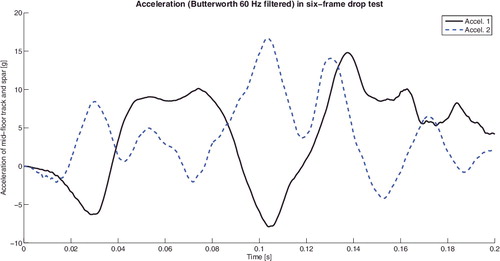
Figure 5. Acceleration from A320 drop test and comparable floor simulation from Hashemi et al. [Citation14].
![Figure 5. Acceleration from A320 drop test and comparable floor simulation from Hashemi et al. [Citation14].](/cms/asset/d25ffa90-2a11-452d-bb72-f4bfd8f3758e/tcrs_a_1273987_f0005_b.gif)
Figure 6. Portside seat accelerations, 60-Hz Butterworth, low-pass filtered.
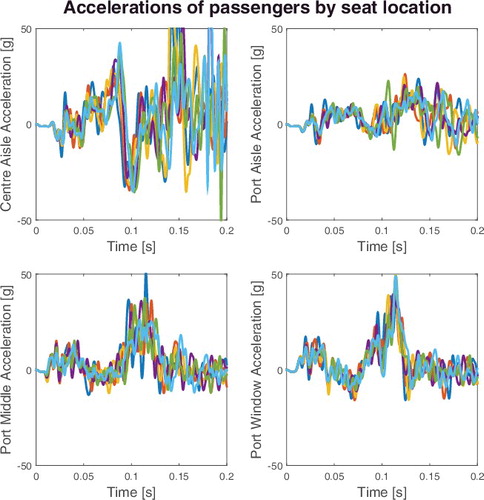
Figure 7. Starboard seat accelerations, 60-Hz Butterworth low-pass filtered.
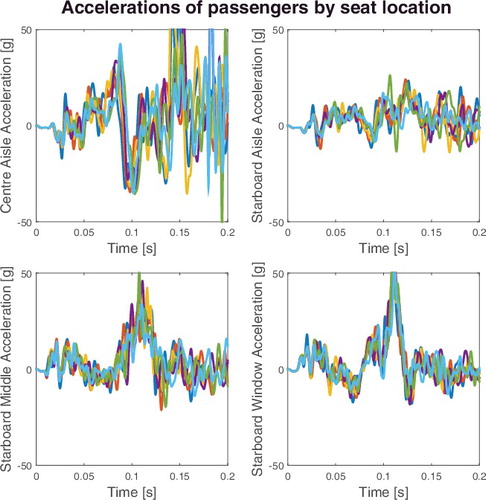
Figure 8. Six half-frame von Mises stress level comparison: (a) Metal, (b) quasi-isotropic composite, (c) ply-by-ply composite.
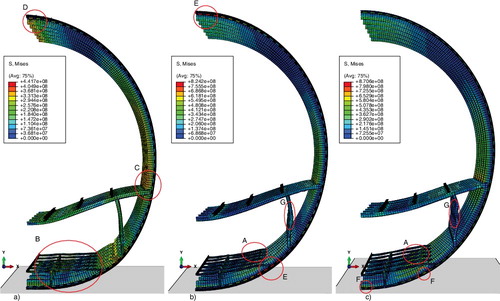
Figure 9. Six-frame (half-barrel) plasticity level comparison: (a) Metal, (b) quasi-isotropic composite, (c) ply-by-ply composite.
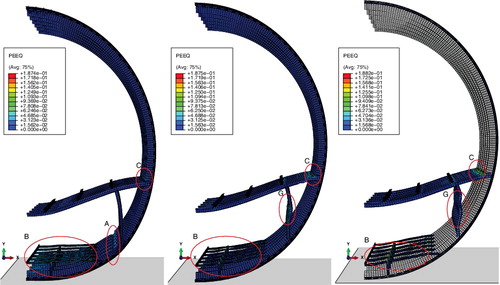
Figure 10. Six-frame kinetic, plastic dissipation and damage dissipation energies for each model.
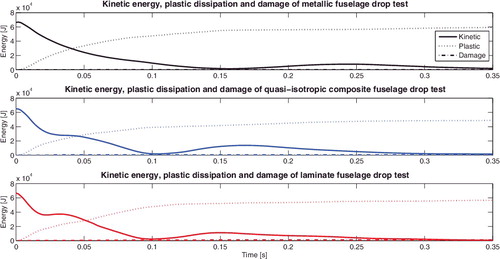
Figure 11. Six-frame energy comparison between composite and metallic sections.
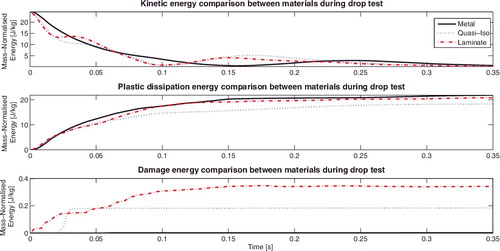
Table 3. Model masses.
Table 4. Average and measured accelerations.
Figure 12. Acceleration comparison using Butterworth filtered signal between three material models.
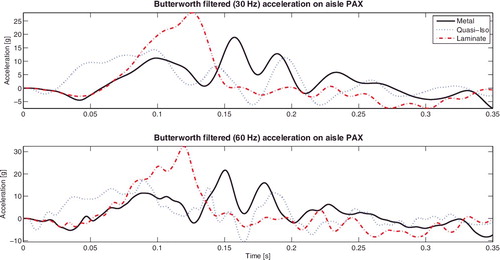
Figure 13. Six-frame model Eiband plot showing the severity of impact. Redrawn from [Citation6,Citation22].
![Figure 13. Six-frame model Eiband plot showing the severity of impact. Redrawn from [Citation6,Citation22].](/cms/asset/bf6b26a7-4aa0-4b61-a275-58d900496f64/tcrs_a_1273987_f0013_oc.jpg)